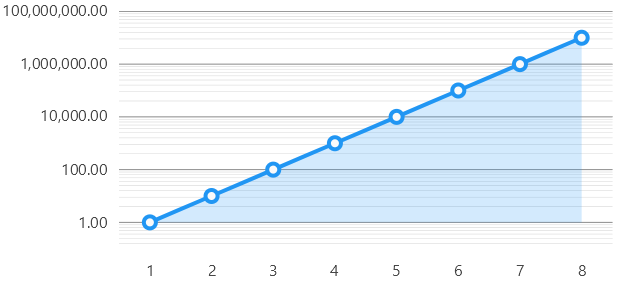
Logarithmic Scale
View model
using System;
using SkiaSharp;
using LiveChartsCore;
using LiveChartsCore.SkiaSharpView;
using LiveChartsCore.SkiaSharpView.Painting;
using LiveChartsCore.Kernel.Sketches;

namespace ViewModelsSamples.Axes.Logarithmic;

public class ViewModel
{
    // base 10 log, change the base if you require it.
    // or use any custom scale the logic is the same.
    private static readonly int s_logBase = 10;

    public ISeries[] Series { get; set; } = [
        new LineSeries<LogarithmicPoint>
        {
            Values = [
                new() { X = 1, Y = 1 },
                new() { X = 2, Y = 10 },
                new() { X = 3, Y = 100 },
                new() { X = 4, Y = 1000 },
                new() { X = 5, Y = 10000 },
                new() { X = 6, Y = 100000 },
                new() { X = 7, Y = 1000000 },
                new() { X = 8, Y = 10000000 }
            ],

            // lets map the values to the logarithmic scale // mark
            // for the x coordinate, we use the X property // mark
            // and for the Y coordinate, we will map it to the logarithm of the Y value // mark
            Mapping = (logPoint, index) => // mark
                new(logPoint.X, Math.Log(logPoint.Y, s_logBase)), // mark

            // for more info about mappers see:
            // https://livecharts.dev/docs/{{ platform }}/{{ version }}/Overview.Mappers
        }
    ];

    public ICartesianAxis[] YAxes { get; set; } = [
        new LogarithmicAxis(s_logBase)
        {
            SeparatorsPaint = new SolidColorPaint
            {
                Color = SKColors.Black.WithAlpha(100),
                StrokeThickness = 1,
            },
            SubseparatorsPaint = new SolidColorPaint
            {
                Color = SKColors.Black.WithAlpha(50),
                StrokeThickness = 0.5f
            },
            SubseparatorsCount = 9,
        }
    ];
}
LogarithmicPoint.cs
namespace ViewModelsSamples.Axes.Logarithmic;

public struct LogarithmicPoint
{
    public double X { get; set; }
    public double Y { get; set; }
}
HTML
@page "/Axes/Logarithmic"
@using LiveChartsCore.SkiaSharpView.Blazor
@using ViewModelsSamples.Axes.Logarithmic

<CartesianChart
	Series="ViewModel.Series"
	YAxes="ViewModel.YAxes">
</CartesianChart>

@code {
	public ViewModel ViewModel { get; set; } = new();
}
Articles you might also find useful: