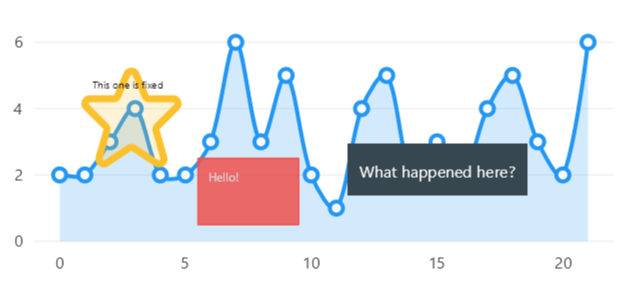
Visual Elements
View model
using System.Collections.Generic;
using CommunityToolkit.Mvvm.ComponentModel;
using LiveChartsCore;
using LiveChartsCore.Drawing;
using LiveChartsCore.Kernel;
using LiveChartsCore.Kernel.Events;
using LiveChartsCore.Measure;
using LiveChartsCore.SkiaSharpView;
using LiveChartsCore.SkiaSharpView.Drawing;
using LiveChartsCore.SkiaSharpView.Drawing.Geometries;
using LiveChartsCore.SkiaSharpView.Painting;
using LiveChartsCore.SkiaSharpView.VisualElements;
using LiveChartsCore.VisualElements;
using SkiaSharp;

namespace ViewModelsSamples.General.VisualElements;

public partial class ViewModel : ObservableObject
{
    public ViewModel()
    {
        var visuals = new List<ChartElement<SkiaSharpDrawingContext>>();

        var rectangleVisual = new GeometryVisual<RectangleGeometry>
        {
            X = 5.5,
            Y = 2.5,
            LocationUnit = MeasureUnit.ChartValues,
            Width = 4,
            Height = 2,
            SizeUnit = MeasureUnit.ChartValues,
            Fill = new SolidColorPaint(new SKColor(239, 83, 80, 220)) { ZIndex = 10 },
            Stroke = new SolidColorPaint(new SKColor(239, 83, 80)) { ZIndex = 10, StrokeThickness = 1.5f },
            Label = "Hello!",
            LabelPaint = new SolidColorPaint(new SKColor(220, 220, 220)) { ZIndex = 11 },
            LabelSize = 12
        };
        // listen for the pointer down event
        rectangleVisual.PointerDown += RectanglePointerDown;
        visuals.Add(rectangleVisual);

        var labelVisual = new LabelVisual
        {
            Text = "What happened here?",
            X = 15,
            Y = 1,
            TextSize = 16,
            Paint = new SolidColorPaint(new SKColor(250, 250, 250)) { ZIndex = 11 },
            BackgroundColor = new LvcColor(55, 71, 79),
            Padding = new Padding(12),
            LocationUnit = MeasureUnit.ChartValues,
            Translate = new LvcPoint(0, -35)
        };
        visuals.Add(labelVisual);

        var svgVisiual = new SVGVisual
        {
            Path = SKPath.ParseSvgPathData(SVGPoints.Star),
            X = 80,
            Y = 80,
            LocationUnit = MeasureUnit.Pixels,
            Width = 100,
            Height = 100,
            SizeUnit = MeasureUnit.Pixels,
            Fill = new SolidColorPaint(new SKColor(251, 192, 45, 50)) { ZIndex = 10 },
            Stroke = new SolidColorPaint(new SKColor(251, 192, 45)) { ZIndex = 10, StrokeThickness = 1.5f },
            Label = "This one is fixed",
            LabelPaint = new SolidColorPaint(SKColors.Black) { ZIndex = 11 },
            LabelSize = 10
        };

        visuals.Add(svgVisiual);

        VisualElements = visuals;
        Series = new ISeries[]
        {
            new LineSeries<int>
            {
                GeometrySize = 13,
                Values = new int[] { 2, 2, 3, 4, 2, 2, 3, 6, 3, 5, 2, 1, 4, 5, 2, 3, 2, 4, 5, 3, 2, 6 }
            }
        };
    }

    public IEnumerable<ChartElement<SkiaSharpDrawingContext>> VisualElements { get; set; }

    public ISeries[] Series { get; set; }

    private void RectanglePointerDown(
        VisualElement<SkiaSharpDrawingContext> visual,
        VisualElementEventArgs<SkiaSharpDrawingContext> visualElementsArgs)
    {
        var rectangleVisual = (GeometryVisual<RectangleGeometry>)visual;

        // toggle the width of the rectangle
        rectangleVisual.Width = rectangleVisual.Width == 4 ? 2 : 4;
    }
}
using Eto.Forms;
using LiveChartsCore.SkiaSharpView.Eto;
using ViewModelsSamples.General.VisualElements;

namespace EtoFormsSample.General.VisualElements;

public class View : Panel
{
    public View()
    {
        var viewModel = new ViewModel();

        var cartesianChart = new CartesianChart
        {
            Series = viewModel.Series,
            VisualElements = viewModel.VisualElements,
            ZoomMode = LiveChartsCore.Measure.ZoomAndPanMode.X
        };

        Content = cartesianChart;
    }
}
Articles you might also find useful: