Basic Candle Sticks
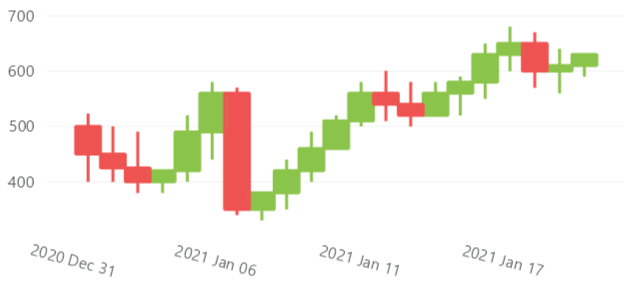

Hover over the image to see the chart animation
This sample uses C# 12 features, it also uses features from the CommunityToolkit.Mvvm package, you can learn more about it here.
View Model
using System;
using System.Linq;
using LiveChartsCore;
using LiveChartsCore.Defaults;
using LiveChartsCore.SkiaSharpView;

namespace ViewModelsSamples.Financial.BasicCandlesticks;

public class ViewModel
{
    public Axis[] XAxes { get; set; }

    public ISeries[] Series { get; set; }

    public ViewModel()
    {
        var data = new FinancialData[]
        {
            new() { Date = new DateTime(2021, 1, 1), High = 523, Open = 500, Close = 450, Low = 400 },
            new() { Date = new DateTime(2021, 1, 2), High = 500, Open = 450, Close = 425, Low = 400 },
            new() { Date = new DateTime(2021, 1, 3), High = 490, Open = 425, Close = 400, Low = 380 },
            new() { Date = new DateTime(2021, 1, 4), High = 420, Open = 400, Close = 420, Low = 380 },
            new() { Date = new DateTime(2021, 1, 5), High = 520, Open = 420, Close = 490, Low = 400 },
            new() { Date = new DateTime(2021, 1, 6), High = 580, Open = 490, Close = 560, Low = 440 }
        };

        Series = [
            new CandlesticksSeries<FinancialPointI>
            {
                Values = data
                    .Select(x => new FinancialPointI(x.High, x.Open, x.Close, x.Low))
                    .ToArray()
            }
        ];

        XAxes = [
            new Axis
            {
                LabelsRotation = 15,
                Labels = data
                    .Select(x => x.Date.ToString("yyyy MMM dd"))
                    .ToArray()
            }
        ];
    }
}

public class FinancialData
{
    public DateTime Date { get; set; }
    public double High { get; set; }
    public double Open { get; set; }
    public double Close { get; set; }
    public double Low { get; set; }
}
XAML
<?xml version="1.0" encoding="utf-8" ?>
<ContentPage x:Class="MauiSample.Financial.BasicCandlesticks.View"
             xmlns="http://schemas.microsoft.com/dotnet/2021/maui"
             xmlns:x="http://schemas.microsoft.com/winfx/2009/xaml"
             xmlns:lvc="clr-namespace:LiveChartsCore.SkiaSharpView.Maui;assembly=LiveChartsCore.SkiaSharpView.Maui"
             xmlns:vms="clr-namespace:ViewModelsSamples.Financial.BasicCandlesticks;assembly=ViewModelsSamples"
             >
    <ContentPage.BindingContext>
        <vms:ViewModel/>
    </ContentPage.BindingContext>
	<ContentPage.Content>
        <Grid>
            <Grid.RowDefinitions>
                <RowDefinition Height="*"/>
            </Grid.RowDefinitions>

            <lvc:CartesianChart
                Series="{Binding Series}"
                XAxes="{Binding XAxes}">
            </lvc:CartesianChart>

        </Grid>
    </ContentPage.Content>
</ContentPage>