Visual Elements
This sample uses C# 12 features, it also uses features from the CommunityToolkit.Mvvm package, you can learn more about it here.
This web site wraps every sample using a ContentPage instance, but LiveCharts controls can be used inside any container.
We can add custom elements to a chart using the VisualElements property, this property is of type IEnumerable<ChartElement>,
the library provides the Visual class, this class inherits from ChartElement and handles animations, the PointerDown event and
the creation and destruction of the drawn geometries in the canvas.
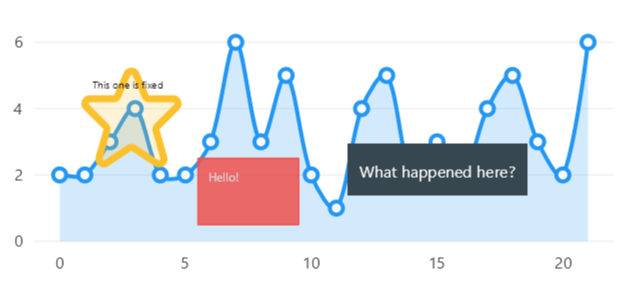
In the next example, we create a CartesianChart, this chart contains multiple visual elements, each visual element is defined below in this article:
View Model
using System.Collections.Generic;
using LiveChartsCore;
using LiveChartsCore.Kernel;

namespace ViewModelsSamples.General.VisualElements;

public class ViewModel
{
    public IEnumerable<ChartElement> VisualElements { get; set; }

    public ISeries[] Series { get; set; }

    public ViewModel()
    {
        VisualElements = [
            new RectangleVisual(),
            new ScaledRectangleVisual(),
            new PointerDownAwareVisual(),
            new SvgVisual(),
            new CustomVisual(),
            new AbsoluteVisual(),
            new StackedVisual(),
            new TableVisual(),
            new ContainerVisual(),
        ];

        // no series are needed for this example
        Series = [];
    }
}
XAML
<?xml version="1.0" encoding="utf-8" ?>
<ContentPage x:Class="MauiSample.General.VisualElements.View"
             xmlns="http://schemas.microsoft.com/dotnet/2021/maui"
             xmlns:x="http://schemas.microsoft.com/winfx/2009/xaml"
             xmlns:lvc="clr-namespace:LiveChartsCore.SkiaSharpView.Maui;assembly=LiveChartsCore.SkiaSharpView.Maui"
             xmlns:vms="clr-namespace:ViewModelsSamples.General.VisualElements;assembly=ViewModelsSamples">

    <ContentPage.BindingContext>
        <vms:ViewModel/>
    </ContentPage.BindingContext>

    <lvc:CartesianChart
        Series="{Binding Series}"
        VisualElements="{Binding VisualElements}"
        ZoomMode="X">
    </lvc:CartesianChart>

</ContentPage>
Basic sample
In the next example, we define the RectangleVisual class, this class inherits from Visual, then we override the Measure method
and the DrawnElement property.
using LiveChartsCore;
using LiveChartsCore.SkiaSharpView.Drawing.Geometries;
using LiveChartsCore.SkiaSharpView.Painting;
using LiveChartsCore.VisualElements;
using SkiaSharp;

namespace ViewModelsSamples.General.VisualElements;

public class RectangleVisual : Visual
{
    protected override RectangleGeometry DrawnElement { get; } =
        new RectangleGeometry { Fill = new SolidColorPaint(SKColors.Red) };

    protected override void Measure(Chart chart)
    {
        DrawnElement.X = 100;
        DrawnElement.Y = 100;
        DrawnElement.Width = 40;
        DrawnElement.Height = 40;
    }
}
In the Measure method, we must define the properties of the DrawnElement, this method will be called every time the chart is measured;
Now for the DrawnElement property, we override the return type using the covariant returns
feature, this means that we can override the type of the DrawnElement property, but the new type must implement IDrawnElement, this interface
is implement by any object drawn by LiveCharts, you can use the geometries already defined in the library
(here is a list)
or you can define your own geometries as soon as they implement this interface.
Scaled shapes
Normally, we need to scale the drawn shapes based on the chart data, you can use the ScaleDataToPixels method to do so:
using LiveChartsCore;
using LiveChartsCore.Drawing;
using LiveChartsCore.Kernel.Sketches;
using LiveChartsCore.SkiaSharpView.Drawing.Geometries;
using LiveChartsCore.SkiaSharpView.Painting;
using LiveChartsCore.VisualElements;
using SkiaSharp;

namespace ViewModelsSamples.General.VisualElements;

public class ScaledRectangleVisual : Visual
{
    protected override RectangleGeometry DrawnElement { get; } =
        new RectangleGeometry { Fill = new SolidColorPaint(SKColors.Red) };

    protected override void Measure(Chart chart)
    {
        var cartesianChart = (ICartesianChartView)chart.View;

        // use the ScaleDataToPixels function to scale data.
        var locationInDataScale = new LvcPointD(5, 5);
        var locationInPixels = cartesianChart.ScaleDataToPixels(locationInDataScale);

        DrawnElement.X = (float)locationInPixels.X;
        DrawnElement.Y = (float)locationInPixels.Y;
        DrawnElement.Width = 40;
        DrawnElement.Height = 40;
    }
}
PointerDown event
You can subscribe to the PointerDown event to detect when the user pointer goes down on the element.
using System.Diagnostics;
using LiveChartsCore;
using LiveChartsCore.Kernel.Events;
using LiveChartsCore.SkiaSharpView.Drawing.Geometries;
using LiveChartsCore.SkiaSharpView.Painting;
using LiveChartsCore.VisualElements;
using SkiaSharp;

namespace ViewModelsSamples.General.VisualElements;

public class PointerDownAwareVisual : Visual
{
    public PointerDownAwareVisual()
    {
        PointerDown += OnPointerDown;
    }

    private void OnPointerDown(IInteractable visual, VisualElementEventArgs visualElementsArgs)
    {
        var location = visualElementsArgs.PointerLocation;
        Trace.WriteLine($"Pointer down at {location.X}, {location.Y}");
    }

    protected override RectangleGeometry DrawnElement { get; } =
        new RectangleGeometry { Fill = new SolidColorPaint(SKColors.Red) };

    protected override void Measure(Chart chart)
    {
        DrawnElement.X = 150;
        DrawnElement.Y = 100;
        DrawnElement.Width = 40;
        DrawnElement.Height = 40;
    }
}
Svg shapes
Use the VariableSVGPathGeometry as the DrawnElement to draw svg paths:
using LiveChartsCore;
using LiveChartsCore.Drawing;
using LiveChartsCore.SkiaSharpView.Drawing.Geometries;
using LiveChartsCore.SkiaSharpView.Painting;
using LiveChartsCore.VisualElements;
using SkiaSharp;

namespace ViewModelsSamples.General.VisualElements;

public class SvgVisual : Visual
{
    protected override VariableSVGPathGeometry DrawnElement { get; } =
        new VariableSVGPathGeometry
        {
            Stroke = new SolidColorPaint(SKColors.Blue),
            Path = SKPath.ParseSvgPathData(SVGPoints.Star)
        };

    protected override void Measure(Chart chart)
    {
        DrawnElement.X = 200;
        DrawnElement.Y = 100;
        DrawnElement.Width = 40;
        DrawnElement.Height = 40;
    }
}
Custom IDrawnElement
The easiest way is to inherit from DrawnGeometry, this class implements IDrawnElement and also animates all of its properties;
In the next example we inherit from BoundedDrawnGeometry it only adds the Width and Height properties to the DrawnGeometry class.

using LiveChartsCore.Drawing;
using LiveChartsCore.SkiaSharpView.Drawing;

namespace ViewModelsSamples.General.VisualElements;

public class CustomSkiaShape : BoundedDrawnGeometry, IDrawnElement<SkiaSharpDrawingContext>
{
    public void Draw(SkiaSharpDrawingContext context)
    {
        var canvas = context.Canvas;
        var paint = context.ActiveSkiaPaint;

        var x = X + Width / 2f;
        var y = Y + Height / 2f;
        var r = (float)Width / 2f;

        canvas.DrawCircle(x, y, r, paint);
        canvas.DrawCircle(x, y, r * 0.75f, paint);
        canvas.DrawCircle(x, y, r * 0.5f, paint);
    }
}
Finally, we need to define a Visual that uses this geometry as the DrawnElement:
using LiveChartsCore;
using LiveChartsCore.SkiaSharpView.Painting;
using LiveChartsCore.VisualElements;
using SkiaSharp;

namespace ViewModelsSamples.General.VisualElements;

public class CustomVisual : Visual
{
    protected override CustomSkiaShape DrawnElement { get; } =
        new CustomSkiaShape { Stroke = new SolidColorPaint(SKColors.Red) };

    protected override void Measure(Chart chart)
    {
        DrawnElement.X = 250;
        DrawnElement.Y = 100;
        DrawnElement.Width = 40;
        DrawnElement.Height = 40;
    }
}
If you need to define your own properties and these properties must be animated, you must use the MotionProperty<T> class, please see the
draw on canvas sample for more info.
Layouts
LiveCharts provides a small layout framework, this is used by the library to render the tooltips and legends,
Layouts also implement IDrawnElement, but they are not drawn in the UI, instead they just define the coordinates
of the elements inside when an element is added to a layout, the coordinates of these elements are relative to the
layout, here is a list
of the layouts defined in the library.
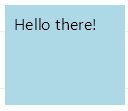
Container Layout
A container is just a shape that can host other drawn elements as the content of this shape, a container takes the size of its content, and can
set the Fill and Stroke properties of this shape. an example in the library is the default tooltip, it is of type Container<PopUpGeometry>
then it sets the Geometry.Fill to define the background of the tooltip.
using LiveChartsCore;
using LiveChartsCore.Drawing;
using LiveChartsCore.SkiaSharpView.Drawing.Geometries;
using LiveChartsCore.SkiaSharpView.Drawing.Layouts;
using LiveChartsCore.SkiaSharpView.Painting;
using LiveChartsCore.VisualElements;
using SkiaSharp;

namespace ViewModelsSamples.General.VisualElements;

public class ContainerVisual : Visual
{
    private readonly Container _container;

    public ContainerVisual()
    {
        _container = new Container
        {
            Content = new LabelGeometry
            {
                Text = "Hello",
                TextSize = 20,
                Padding = new(10),
                Paint = new SolidColorPaint(SKColors.Black),
                VerticalAlign = Align.Start,
                HorizontalAlign = Align.Start
            }
        };

        _container.Geometry.Stroke = new SolidColorPaint(SKColors.Black, 3);
        _container.Geometry.Fill = new SolidColorPaint(SKColors.LightGray);
    }

    protected override Container DrawnElement => _container;

    protected override void Measure(Chart chart)
    {
        DrawnElement.X = 500;
        DrawnElement.Y = 100;
    }
}
Absolute Layout
Used to place children on its own coordinate system, all the children X and Y coordinates are relative to the Layout position, the layout takes
the size of the largest element in the children collection. For example in the next case, we place the place the RectangleGeometryin the 0,0 coordinate [in the layout system] and theLabelGeometry` in the 10,0 coordinate.
using LiveChartsCore;
using LiveChartsCore.Drawing;
using LiveChartsCore.SkiaSharpView.Drawing.Geometries;
using LiveChartsCore.SkiaSharpView.Drawing.Layouts;
using LiveChartsCore.SkiaSharpView.Painting;
using LiveChartsCore.VisualElements;
using SkiaSharp;

namespace ViewModelsSamples.General.VisualElements;

public class AbsoluteVisual : Visual
{
    protected override AbsoluteLayout DrawnElement { get; } =
        new AbsoluteLayout
        {
            // X and Y coordinates are relative to the parent
            Children = [
                new RectangleGeometry
                {
                    X = 0,
                    Y = 0,
                    Width = 40,
                    Height = 40,
                    Fill = new SolidColorPaint(SKColors.Gray)
                },
                new LabelGeometry
                {
                    X = 10,
                    Y = 10,
                    Text = "Hello",
                    TextSize = 10,
                    HorizontalAlign = Align.Start,
                    VerticalAlign = Align.Start,
                    Paint = new SolidColorPaint(SKColors.Black)
                }
            ]
        };

    protected override void Measure(Chart chart)
    {
        DrawnElement.X = 300;
        DrawnElement.Y = 100;
        DrawnElement.Width = 40;
        DrawnElement.Height = 40;
    }
}
Stacked Layout
Stacks IDrawnElement objects in vertical or horizontal order.

using LiveChartsCore;
using LiveChartsCore.Drawing;
using LiveChartsCore.SkiaSharpView.Drawing.Geometries;
using LiveChartsCore.SkiaSharpView.Drawing.Layouts;
using LiveChartsCore.SkiaSharpView.Painting;
using LiveChartsCore.VisualElements;
using SkiaSharp;

namespace ViewModelsSamples.General.VisualElements;

public class StackedVisual : Visual
{
    protected override StackLayout DrawnElement { get; } =
        new StackLayout
        {
            // X and Y coordinates are relative to the parent
            Orientation = ContainerOrientation.Vertical,
            Children = [
                new CircleGeometry
                {
                    Width = 40,
                    Height = 40,
                    Fill = new SolidColorPaint(SKColors.CadetBlue)
                },
                new RectangleGeometry
                {
                    Width = 40,
                    Height = 40,
                    Fill = new SolidColorPaint(SKColors.DeepSkyBlue)
                },
                new DiamondGeometry
                {
                    Width = 40,
                    Height = 40,
                    Fill = new SolidColorPaint(SKColors.LightSteelBlue)
                }
            ]
        };

    protected override void Measure(Chart chart)
    {
        DrawnElement.X = 350;
        DrawnElement.Y = 100;
    }
}
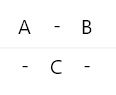
Table Layout
Uses a grid system to place IDrawnElement objects.
using LiveChartsCore;
using LiveChartsCore.Drawing;
using LiveChartsCore.SkiaSharpView.Drawing.Geometries;
using LiveChartsCore.SkiaSharpView.Drawing.Layouts;
using LiveChartsCore.SkiaSharpView.Painting;
using LiveChartsCore.VisualElements;
using SkiaSharp;

namespace ViewModelsSamples.General.VisualElements;

public class TableVisual : Visual
{
    protected override TableLayout DrawnElement { get; } =
        new TableLayout
        {
            Cells = [
                new(0, 0, GetLabel("A")),
                new(0, 1, GetLabel("-")),
                new(0, 2, GetLabel("B")),
                new(1, 0, GetLabel("-")),
                new(1, 1, GetLabel("C")),
                new(1, 2, GetLabel("-"))
            ],
        };

    protected override void Measure(Chart chart)
    {
        DrawnElement.X = 400;
        DrawnElement.Y = 100;
    }

    private static LabelGeometry GetLabel(string text) =>
        new()
        {
            Text = text,
            TextSize = 20,
            Padding = new(10),
            Paint = new SolidColorPaint(SKColors.Black),
            VerticalAlign = Align.Start,
            HorizontalAlign = Align.Start
        };
}
Update on property change
To do...