Column Series Properties
This article do not include all the properties of the Column Series Properties class, it only highlights some features, to explore the full object checkout the API explorer
Name property
The name property is a string identifier that is normally used in tooltips and legends to display the data name, if this property is not set, then the library will generate a name for the series that by default is called "Series 1" when it is the first series in the series collection, "Series 2" when it is the second series in the series collection, "Series 3" when it is the third series in the series collection, and so on a series n will be named "Series n".
SeriesCollection = new ISeries[]
{
    new ColumnSeriesProperties<int>
    {
        Values = new []{ 2, 5, 4, 2, 6 },
        Name = "Income", // mark
        Stroke = null
    },
    new ColumnSeriesProperties<int>
    {
        Values = new []{ 3, 7, 2, 9, 4 },
        Name = "Outcome", // mark
        Stroke = null
    }
};
Values property
The Values property is of type IEnumerable<T>, this means that you can use any object that implements the IEnumerable<T> interface,
such as Array, List<T> or ObservableCollection<T>, this property contains the data to plot, you can use any type as the
generic argument (<T>) as soon as you let the library how to handle it, the library already knows how to handle multiple types,
but you can register any type and teach the library how to handle any object in a chart, for more information please see the
mappers article.
var series1 = new ColumnSeriesProperties<int>
{
    Values = new List<int> { 2, 1, 3 }
};

// == Update the chart when a value is added, removed or replaced  == // mark
// using ObservableCollections allows the chart to update
// every time you add a new element to the values collection
// (not needed in Blazor, it just... updates)
var series2 = new ColumnSeriesProperties<double>
{
    Values = new ObservableCollection<double> { 2, 1, 3 }
}
series2.add(4); // and the chart will animate the change!

// == Update the chart when a property in our collection changes  == // mark
// if the object implements INotifyPropertyChanged, then the chart will
// update automatically when a property changes, the library already provides
// many 'ready to go' objects such as the ObservableValue class.
var observableValue =  new ObservableValue(5);
var series3 = new ColumnSeriesProperties<ObservableValue>
{
    Values = new ObservableCollection<ObservableValue> { observableValue },
}
observableValue.Value = 9; // the chart will animate the change from 5 to 9!

// == Passing X and Y coordinates // mark
// you can indicate both, X and Y using the Observable point class.
// or you could define your own object using mappers.
var series4 = new ColumnSeriesProperties<ObservablePoint>
{
    Values = new ObservableCollection<ObservablePoint> { new ObservablePoint(2, 6)}
}
// == Custom types and mappers == // mark
// finally you can also use your own object, take a look at the City class.
public class City
{
public string Name { get; set; }
public double Population { get; set; }
}// we must let the series know how to handle the city class.
// use the Mapping property to build a point from the city class
// you could also register the map globally.
// for more about global mappers info see:
// https://livecharts.dev/docs/blazor/2.0.0-beta.950/Overview.Mappers
var citiesSeries = new ColumnSeriesProperties<City>
{
Values = new City[]
{
new City { Name = "Tokio", Population = 9 },
new City { Name = "New York", Population = 11 },
new City { Name = "Mexico City", Population = 10 },
},
Mapping = (city, point) =>
{
// this function will be called for every city in our data collection
// in this case Tokio, New York and Mexico city
// it takes the city and the point in the chart liveCharts built for the given city
// you must map the coordinates to the point
// use the Population property as the primary value (normally Y)
point.PrimaryValue = (float)city.Population;
// use the index of the city in our data collection as the secondary value
// (normally X)
point.SecondaryValue = point.Context.Index;
}
};Automatic updates do not have a significant performance impact in most of the cases!
Data labels
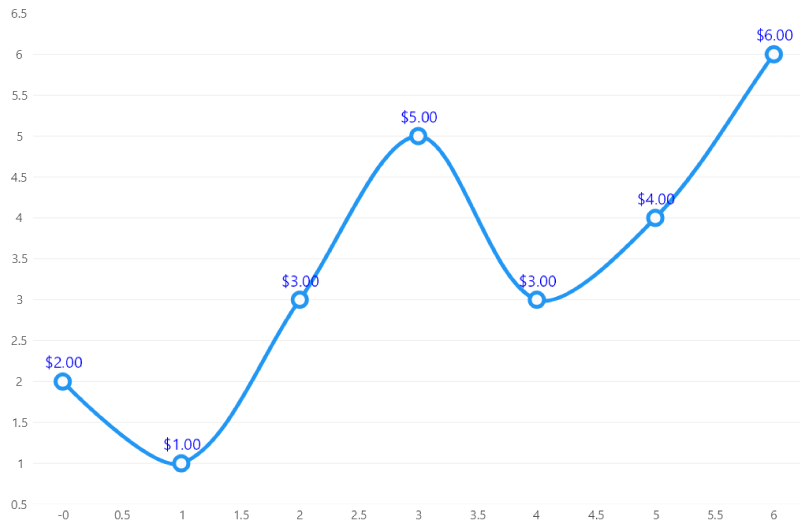
Data labels are labels for every point in a series, there are multiple properties to customize them, take a look at the following sample:
new ColumnSeriesProperties<double>
{
    DataLabelsSize = 20,
    DataLabelsPaint = new SolidColorPaint(SKColors.Blue),
    // all the available positions at:
    // https://livecharts.dev/api/2.0.0-beta.950/LiveChartsCore.Measure.DataLabelsPosition
    DataLabelsPosition = LiveChartsCore.Measure.DataLabelsPosition.Top,
    // The DataLabelsFormatter is a function
    // that takes the current point as parameter
    // and returns a string.
    // in this case we returned the PrimaryValue property as currency
    DataLabelsFormatter = (point) => point.PrimaryValue.ToString("C2"),
    Values = new ObservableCollection<double> { 2, 1, 3, 5, 3, 4, 6 },
    Fill = null
}
The previous series will result in the following chart:
Stroke property
If the stroke property is not set, then LiveCharts will create it based on the series position in your series collection and the current theme.
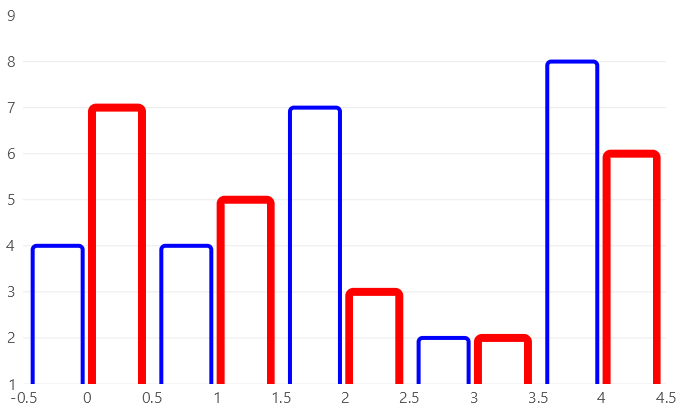
Series = new ISeries[]
{
    new ColumnSeries<int>
    {
        Values = new [] { 4, 4, 7, 2, 8 },
        Stroke = new SolidColorPaint(SKColors.Blue) { StrokeThickness = 4 }, // mark
        Fill = null,
    },
    new ColumnSeries<int>
    {
        Values = new [] { 7, 5, 3, 2, 6 },
        Stroke = new SolidColorPaint(SKColors.Red) { StrokeThickness = 8 }, // mark
        Fill = null,
    }
};
Paints can create gradients, dashed lines and more, if you need help using the Paint instances take
a look at the Paints article.
Fill property
If the fill property is not set, then LiveCharts will create it based on the series position in your series collection and the current theme.
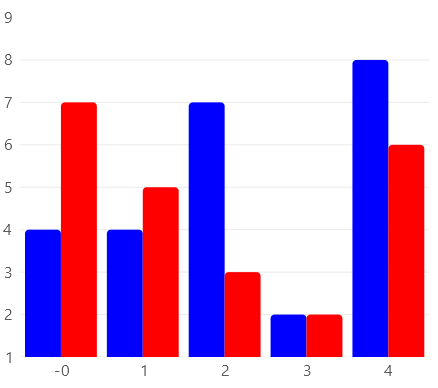
Series = new ISeries[]
{
    new ColumnSeries<int>
    {
        Values = new [] { 4, 4, 7, 2, 8 },
        Fill = new SolidColorPaint(SKColors.Blue), // mark
        Stroke = null
    },
    new ColumnSeries
    {
        Values = new [] { 7, 5, 3, 2, 6 },
        Fill = new SolidColorPaint(SKColors.Red), // mark
        Stroke = null
    }
};
Paints can create gradients, dashed lines and more, if you need help using the Paint instances take
a look at the Paints article.
Rx and Ry properties
These properties define the corners radius in the rectangle geometry.
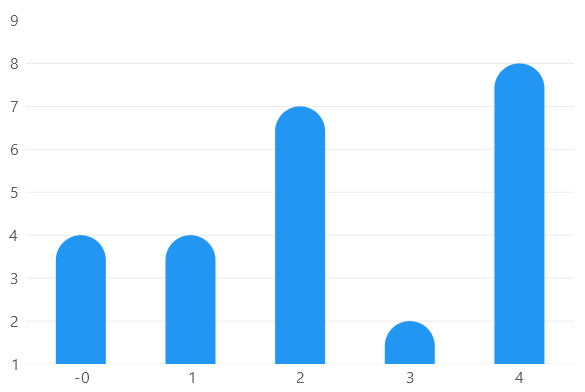
Series = new ISeries[]
{
    new ColumnSeries<int>
    {
        Values = new [] { 4, 4, 7, 2, 8 },
        Rx = 50, // mark
        Ry = 50 // mark
    }
};
MaxBarWidth property
Specifies the maximum width a column can take, take a look at the following sample, where the max width is 10.
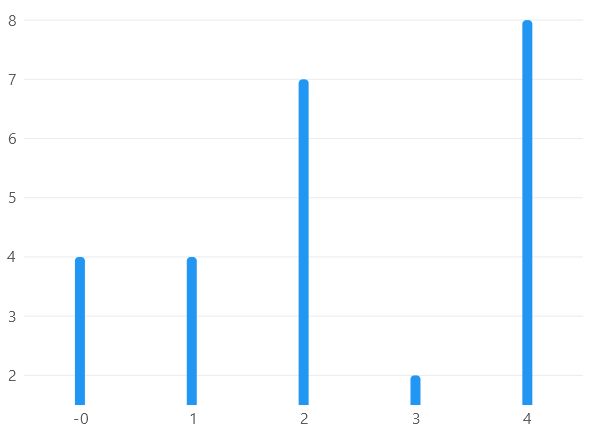
Series = new ISeries[]
{
    new ColumnSeries<int>
    {
        Values = new [] { 4, 4, 7, 2, 8 },
        MaxBarWidth = 10 // mark
    }
};
But now lets use double.MaxValue to see the difference.
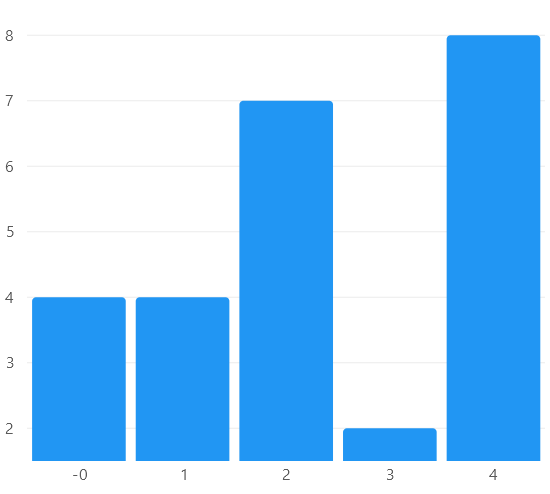
Series = new ISeries[]
{
    new ColumnSeries<int>
    {
        Values = new [] { 4, 4, 7, 2, 8 },
        MaxBarWidth = double.MaxValue // mark
    }
};
Finally we could aso set the padding to 0.
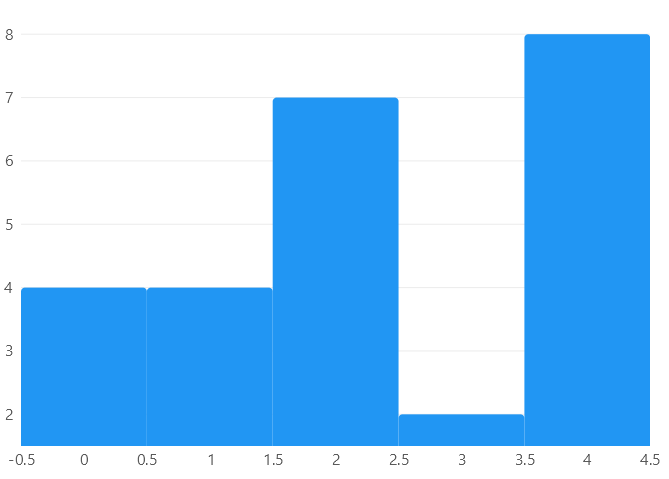
Series = new ISeries[]
{
new ColumnSeries<int>
{
Values = new [] { 4, 4, 7, 2, 8 },
MaxBarWidth = double.MaxValue,
GroupPadding = 0 // mark
}
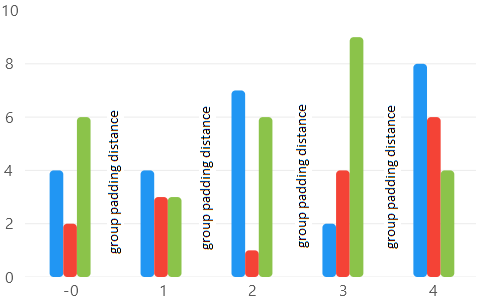
};GroupPadding property
Defines the distance between every group of columns in the plot, a group of columns is all the column that share the same
secondary value coordinate, in the following image there are 5 groups of columns, the first one the columns that share the
0 coordinate, the second one shares the 1, the third group shares the 2 coordinate, the forth group shares the 3 coordinate,
finally the fifth group shares the 4 coordinate.
To highlight this feature the following code uses the ColumnSeries class, but it works the same for the StackedColumnSeries notice the sample above is using the GroupPadding property also.
Series = new ISeries[]
{
new ColumnSeries<int>
{
Values = new [] { 4, 4, 7, 2, 8 },
GroupPadding = 50 // mark
},
new ColumnSeries<int>
{
Values = new [] { 2, 3,1, 4, 6 },
GroupPadding = 50 // mark
},
new ColumnSeries<int>
{
Values = new [] { 6, 3, 6, 9, 4 },
GroupPadding = 50 // mark
}
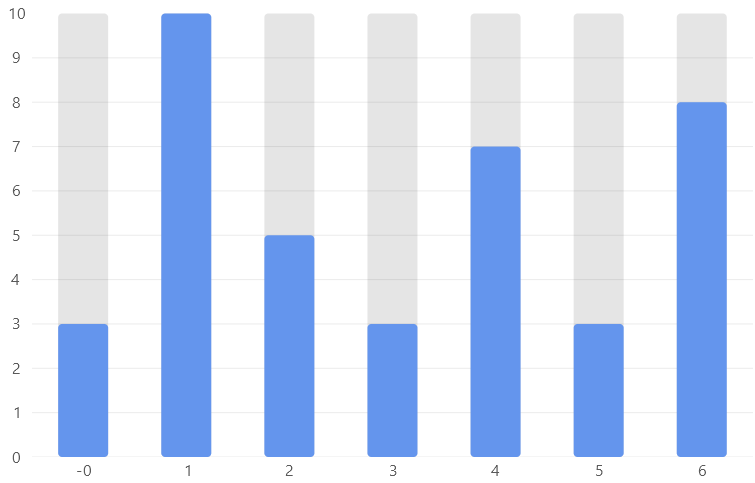
};IgnoresBarPosition property
The ignores bar position property let the series ignore all the other bar series in the same coordinate, this is useful to create backgrounds for columns, take a look at the following sample:
Series = new ISeries[]
{
    new ColumnSeries<double>
    {
        Values = new ObservableCollection<double> { 10, 10, 10, 10, 10, 10, 10 },
        Stroke = null,
        Fill = new SolidColorPaint(new SKColor(30, 30, 30, 30)),
        IgnoresBarPosition = true // mark
    },
    new ColumnSeries<double>
    {
        Values = new ObservableCollection<double> { 3, 10, 5, 3, 7, 3, 8 },
        Stroke = null,
        Fill = new SolidColorPaint(SKColors.CornflowerBlue),
        IgnoresBarPosition = true // mark
    }
};
Plotting custom types
You can teach LiveCharts to plot any type as soon as you let the library how to handle that object, there are
two ways of doing so: Mappers or implementing IChartEntity, mappers are quick to setup, implementing
IChartEntity is more performant and is the recommended way.
Mappers
public record TempSample(int Time, double Temperature, string Unit);

var chart = new SKCartesianChart
{
    Width = 900,
    Height = 600,
    Series = new[]
    {
        new ColumnSeriesProperties<TempSample>
        {
            Mapping = (sample, chartPoint) =>
            {
                // use temperature as primary value (normally Y)
                chartPoint.PrimaryValue = sample.Temperature;
                // use time as secondary value (normally X)
                chartPoint.SecondaryValue = sample.Time;
            },
            Values = samples
        }
    },
    XAxes = new[] { new Axis { Labeler = value => $"{value} seconds" } },
    YAxes = new[] { new Axis { Labeler = value => $"{value} °C" } }
};

// -------------------------------------------------------------------
// IMPORTANT NOTE
// -------------------------------------------------------------------
// There are 2 special plots that use more than X and Y coordinates.

// Weighted plots: HeatMaps and Bubble charts use 3 coordinates, X, Y and Weight.
// Mapping = (sample, chartPoint) =>
// {
//    chartPoint.PrimaryValue = sample.X;
//    chartPoint.SecondaryValue = sample.Y;
//    chartPoint.TertiaryValue = sample.Weigth;
// }

// While financial Points use 5.
// Coordinate = new Coordinate(High, X, Open, Close, Low);
// Mapping = (sample, chartPoint) =>
// {
//    chartPoint.PrimaryValue = sample.High;
//    chartPoint.SecondaryValue = sample.X;
//    chartPoint.TertiaryValue = sample.Open;
//    chartPoint.QuaternaryValue = sample.Close;
//    chartPoint.QuinaryValue = sample.Low;
//}
Implementing IChartEntity
var chart = new SKCartesianChart
{
    Width = 900,
    Height = 600,
    Series = new[]
    {
        new LineSeries<TempSample>
        {
            Values = samples
        }
    },
    XAxes = new[] { new Axis { Labeler = value => $"{value} seconds" } },
    YAxes = new[] { new Axis { Labeler = value => $"{value} °C" } }
};

// this object uses the CommunityToolkit.Mvvm to implement INotifyPropertyChanged also
public partial class TempSample : ObservableObject, IChartEntity
{
    [ObservableProperty]
    private int _time;

    [ObservableProperty]
    private double _temperature;

    // Use the coordinate property to let LiveCharts know the position of the point.
    public Coordinate Coordinate { get; protected set; }

    // The meta data property is used by LiveCharts to store info about the plot.
    public ChartEntityMetaData? MetaData { get; set; }

    protected override void OnPropertyChanged(PropertyChangedEventArgs e)
    {
        Coordinate = new(Time, Temperature);
        base.OnPropertyChanged(e);
    }
}

// -------------------------------------------------------------------
// IMPORTANT NOTE
// -------------------------------------------------------------------
// There are 2 special plots that use more than X and Y coordinates.

// Weited plots: HeatMaps and Bubble charts use 3 coordinates, X, Y and Weight.
// Coordinate = new Coordinate(X, Y, Weight);
// https://github.com/beto-rodriguez/LiveCharts2/blob/master/src/LiveChartsCore/Defaults/WeightedPoint.cs

// While financial Points use 5.
// Coordinate = new Coordinate(High, X, Open, Close, Low);
// https://github.com/beto-rodriguez/LiveCharts2/blob/master/src/LiveChartsCore/Defaults/FinancialPoint.cs
Custom geometries
You can use any geometry to represent a point in a series.
Series = new List<ISeries>
{
    // use the second argument type to specify the geometry to draw for every point
    // there are already many predefined geometries in the
    // LiveChartsCore.SkiaSharpView.Drawing.Geometries namespace
    new ColumnSeriesProperties<double, RectangleGeometry>
    {
        Values = new double[] { 3, 3, -3, -2, -4, -3, -1 }
    },

    // you can also define your own SVG geometry
    // MyGeometry class let us change the Path at runtime
    // Click on the on any point to change the path.
    // You can find the MyGeometry.cs file below
    new ColumnSeriesProperties<double, MyGeometry>
    {
        Values = new double[] { -2, 2, 1, 3, -1, 4, 3 }
    }

    // Note: Depending on the series type, the geometry could require to satisfy some constrains
};

public class MyGeometry : LiveChartsCore.SkiaSharpView.Drawing.Geometries.SVGPathGeometry
{
    public MyGeometry()
        : base(SVGPoints.Star)
    {
        // the LiveChartsCore.SkiaSharpView.SVGPoints contains many predefined SVG paths
        // you can also pass your own path there.
    }
}
ZIndex property
Indicates an order in the Z axis, this order controls which series is above or behind.
IsVisible property
Indicates if the series is visible in the user interface.
DataPadding
The data padding is the minimum distance from the edges of the series to the axis limits, it is of type System.Drawing.PointF
both coordinates (X and Y) goes from 0 to 1, where 0 is nothing and 1 is the axis tick an axis tick is the separation between
every label or separator (even if they are not visible).
If this property is not set, the library will set it according to the series type, take a look at the following samples:
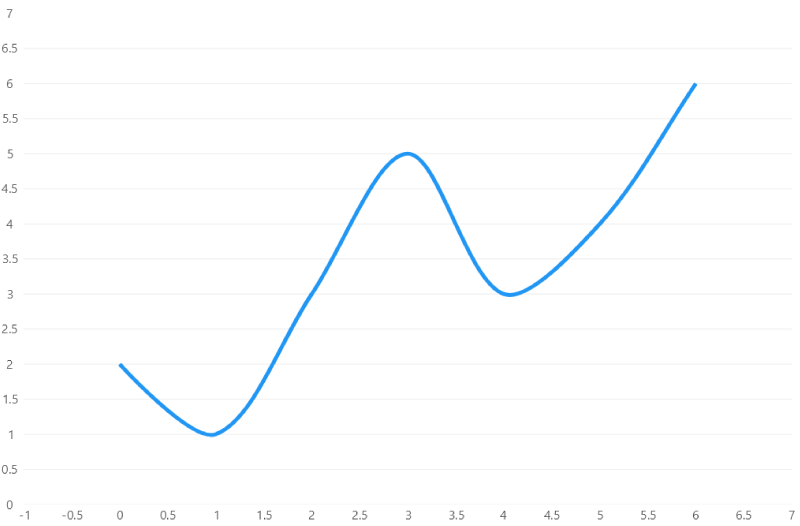
new LineSeries<double>
{
    DataPadding = new System.Drawing.PointF(0, 0),
    Values = new ObservableCollection { 2, 1, 3, 5, 3, 4, 6 },
    GeometryStroke = null,
    GeometryFill = null,
    Fill = null
}
Produces the following result:
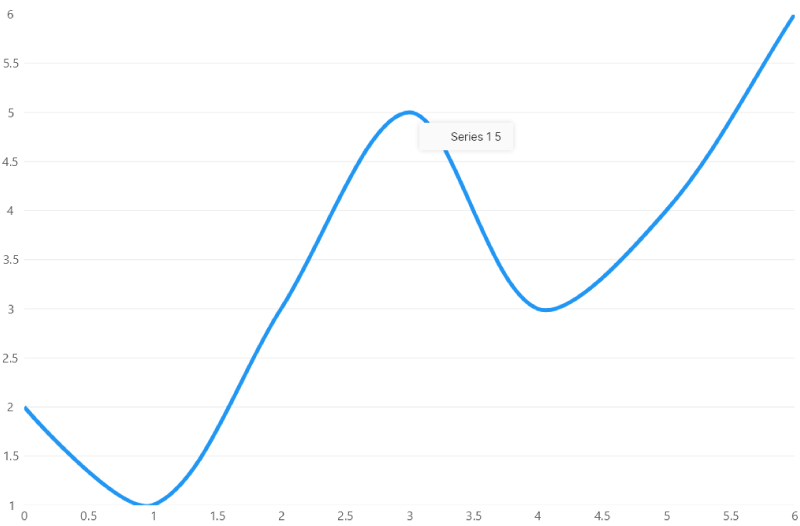
But you can remove the padding only from an axis, for example:
new LineSeries<double>
{
    DataPadding = new System.Drawing.PointF(0.5f, 0),
    Values = new ObservableCollection<double> { 2, 1, 3, 5, 3, 4, 6 },
    GeometryStroke = null,
    GeometryFill = null,
    Fill = null
}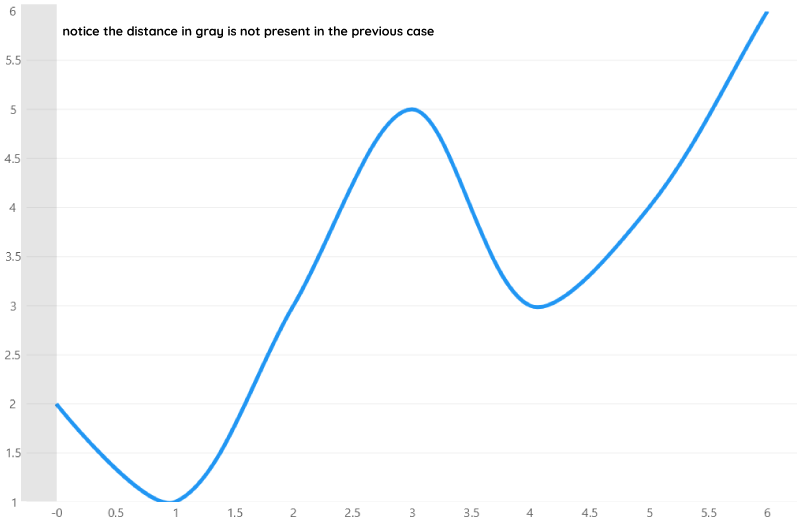
Or you can increase the distance:
new LineSeries<double>
{
    DataPadding = new System.Drawing.PointF(2, 2),
    Values = new ObservableCollection<double> { 2, 1, 3, 5, 3, 4, 6 },
    GeometryStroke = null,
    GeometryFill = null,
    Fill = null
}