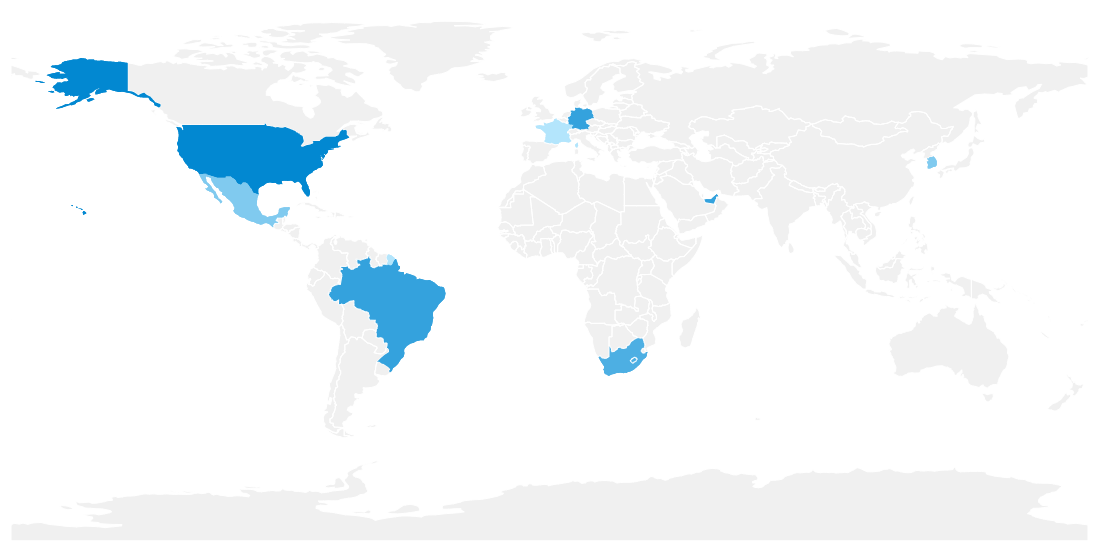
HeatLand series
The HeatLandSeries creates a heat map in the GeoMap control, it helps to assign a numeric value to a region (country, state, continent, ... depends on the map)
then based on the gradient a color will be assigned to each region, colors are interpolated lineally based on the data scale in the series.
@using LiveChartsCore.SkiaSharpView;
@using LiveChartsCore.SkiaSharpView.Drawing.Geometries;
<GeoMap Series="series"></GeoMap>
@code {
private HeatLandSeries[] series = new HeatLandSeries[]
{
new HeatLandSeries
{
// every country has a unique identifier
// check the "shortName" property in the following
// json file to assign a value to a country in the heat map
// https://github.com/beto-rodriguez/LiveCharts2/blob/master/docs/_assets/word-map-index.json
Lands = new HeatLand[]
{
new HeatLand { Name = "bra", Value = 13 },
new HeatLand { Name = "mex", Value = 10 },
new HeatLand { Name = "usa", Value = 15 },
new HeatLand { Name = "deu", Value = 13 },
new HeatLand { Name = "fra", Value = 8 },
new HeatLand { Name = "kor", Value = 10 },
new HeatLand { Name = "zaf", Value = 12 },
new HeatLand { Name = "are", Value = 13 }
}
}
};
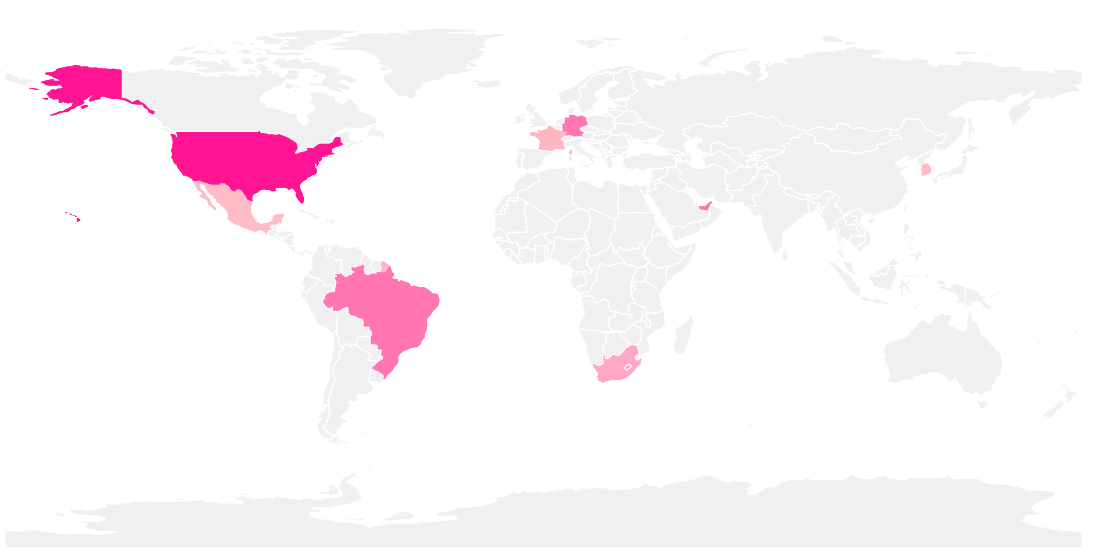
}HeatMap property
This property defines the gradient colors, it is an array of LvcColor
where the first element in the array is the the smallest or coldest and the last item in the array is the greatest or hottest,
any value between the chart limits will be interpolated lineally to create a new color, you can add as many colors as you need
to define the gradient.
When this property is not specified, then it is assigned automatically based on the theme of the library.
@using LiveChartsCore.SkiaSharpView;
@using LiveChartsCore.SkiaSharpView.Drawing.Geometries;

<GeoMap Series="series"></GeoMap>

@code {
    private HeatLandSeries[] series = new HeatLandSeries[]
    {
        new HeatLandSeries
        {
            HeatMap = new[] // mark
            { // mark
                SKColors.LightPink.AsLvcColor(), // the first element is the "coldest" // mark
                SKColors.Pink.AsLvcColor(), // mark
                SKKColors.DeepPink.AsLvcColor() // the last element is the "hottest" // mark
            }, // mark
            Lands = new HeatLand[]
            {
                new HeatLand { Name = "bra", Value = 13 },
                new HeatLand { Name = "mex", Value = 10 },
                new HeatLand { Name = "usa", Value = 15 },
                new HeatLand { Name = "deu", Value = 13 },
                new HeatLand { Name = "fra", Value = 8 },
                new HeatLand { Name = "kor", Value = 10 },
                new HeatLand { Name = "zaf", Value = 12 },
                new HeatLand { Name = "are", Value = 13 }
            }
        }
    };
}
ColorStops property
By default all the colors in the HeatMap property are separated equidistantly, you can define the distance
between each color using the ColorStops property, it is an array of double, every item in the array must
go from 0 to 1, where 0 is the "coldest" and 1 the "hottest", notice in the following sample how the
black to blue gradient is only used in the last 10 percent of the gradient, while the yellow to black is
used in the remaining 90% of the gradient.
@using LiveChartsCore.SkiaSharpView;
@using LiveChartsCore.SkiaSharpView.Drawing.Geometries;

<GeoMap Series="series"></GeoMap>

@code {
    private HeatLandSeries[] series= new HeatLandSeries[]
    {
        new HeatLandSeries
        {
            ColorStops = new[] // mark
            { // mark
                0, // mark
                0.9, // mark
                1 // mark
            }, // mark
            HeatMap = new[]
            {
                SKColors.Yellow.AsLvcColor(), // the first element is the "coldest" // mark
                SKColors.Black.AsLvcColor(), // mark
                SKColors.Blue.AsLvcColor() // the last element is the "hottest" // mark
            },
            Lands = new HeatLand[] { ... }
        }
    };
}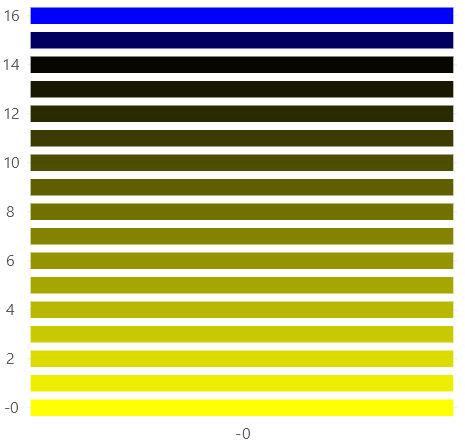
For simplicity the image above shows the cartesian heat series, just to explain the property better.