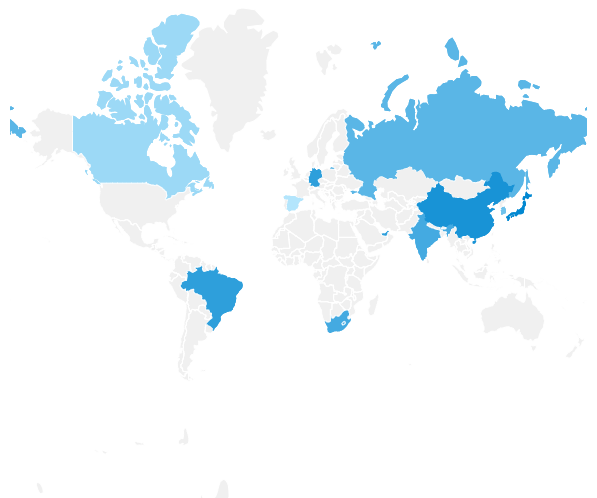
The GeoMap Chart
The GeoMap control is useful to create geographical maps, it uses files in geojson format to render
vectorized maps.
@using LiveChartsCore.SkiaSharpView;
@using LiveChartsCore.SkiaSharpView.Drawing.Geometries;

<GeoMap Series="series"></GeoMap>

@code {
    private HeatLandSeries[] series = new HeatLandSeries[]
    {
        new HeatLandSeries
        {
            // every country has a unique identifier
            // check the "shortName" property in the following
            // json file to assign a value to a country in the heat map
            // https://github.com/beto-rodriguez/LiveCharts2/blob/master/docs/_assets/word-map-index.json
            Lands = new HeatLand[]
            {
                new HeatLand { Name = "bra", Value = 13 },
                new HeatLand { Name = "mex", Value = 10 },
                new HeatLand { Name = "usa", Value = 15 },
                new HeatLand { Name = "deu", Value = 13 },
                new HeatLand { Name = "fra", Value = 8 },
                new HeatLand { Name = "kor", Value = 10 },
                new HeatLand { Name = "zaf", Value = 12 },
                new HeatLand { Name = "are", Value = 13 }
            }
        }
    };
}
Series
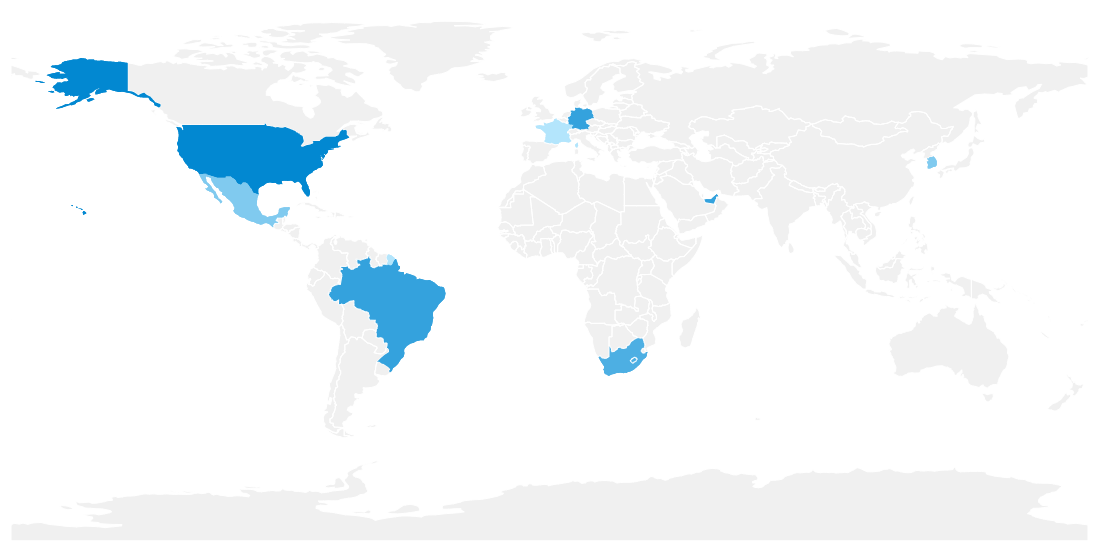
There are multiple series available in the library, you can add one or mix them all in the same chart, every series has unique properties, any image bellow is a link to an article explaining more about them.

Stroke property
Determines the default stroke of every land, if the stroke property is not set, then LiveCharts will create it based on the series position in your series collection and the current theme.
@using LiveChartsCore.SkiaSharpView;
@using LiveChartsCore.SkiaSharpView.Drawing.Geometries;

<GeoMap
    Series="series"
    Stroke="stroke"><!-- mark -->
</GeoMap>

@code {
    private HeatLandSeries[] series = new HeatLandSeries[]
    {
        new HeatLandSeries { Lands = new HeatLand[] { ... } }
    };

    private SolidColorPaint stroke = new SolidColorPaint(SKColors.Red) { StrokeThickness = 2 }; // mark
}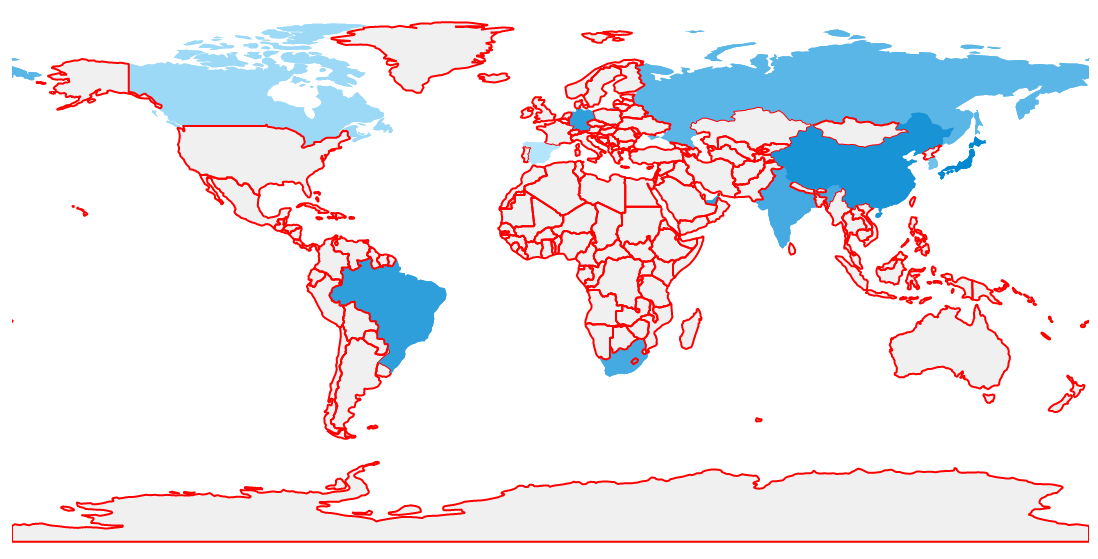
Paints can create gradients, dashed lines and more, if you need help using the Paint instances take
a look at the Paints article.
Fill property
Determines the default fill of every land, if the stroke property is not set, then LiveCharts will create it based on the series position in your series collection and the current theme.
@using LiveChartsCore.SkiaSharpView;
@using LiveChartsCore.SkiaSharpView.Drawing.Geometries;

<GeoMap
    Series="series"
    Fill="fill"><!-- mark -->
</GeoMap>

@code {
    private HeatLandSeries[] series = new HeatLandSeries[]
    {
        new HeatLandSeries { Lands = new HeatLand[] { ... } }
    };

    private SolidColorPaint fill = new SolidColorPaint(SKColors.LightPink); // mark
}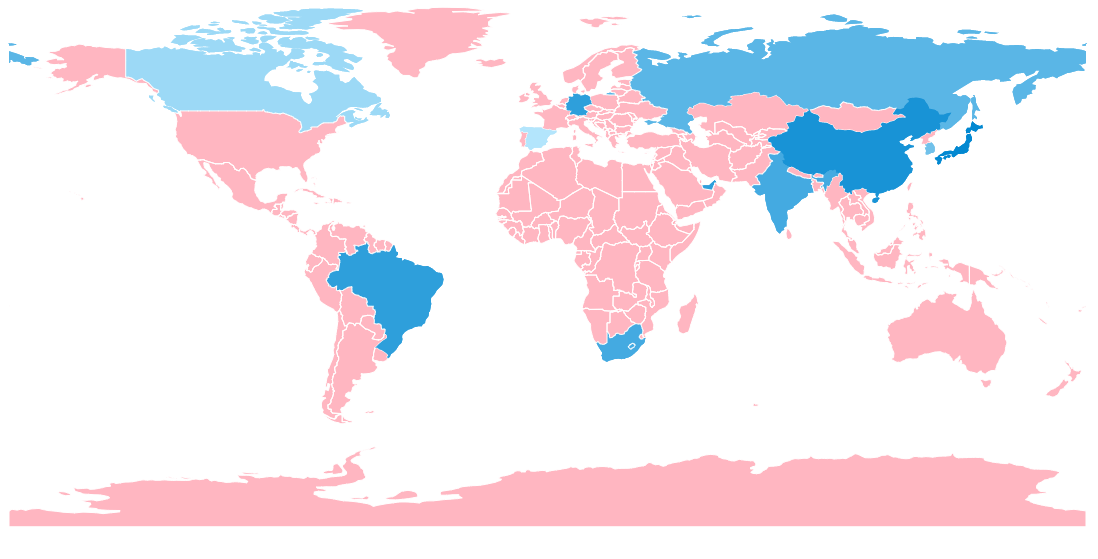
Paints can create gradients, dashed lines and more, if you need help using the Paint instances take
a look at the Paints article.
MapProjection property
Defines the projection of the map coordinates in the control coordinates,
currently it only support the Default (none) and Mercator projections.
<GeoMap
    Series="series"
    MapProjection="LiveChartsCore.Geo.MapProjection.Mercator"><!-- mark -->
</GeoMap>