The Pie Chart Control
This article is a quick guide to use the PieChart control, you can explore all the properties and the source code
at the ApiExplorer.
The PieChart control can build Pie, Doughnut and gauges charts, this article will cover only Pie and Doughnut charts,
if you need to know more about gauges please read
this guide.
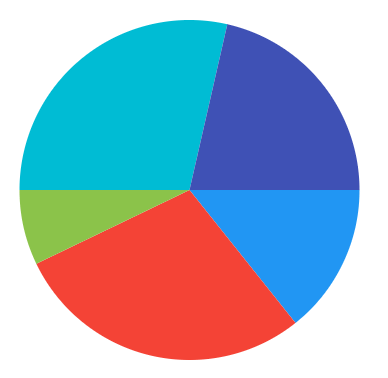
using LiveChartsCore;
using LiveChartsCore.SkiaSharpView;

namespace ViewModelsSamples.Pies.Basic
{
    public class ViewModel
    {
        public ISeries[] Series { get; set; }
            = new ISeries[]
            {
                new PieSeries<double> { Values = new double[] { 2 } },
                new PieSeries<double> { Values = new double[] { 4 } },
                new PieSeries<double> { Values = new double[] { 1 } },
                new PieSeries<double> { Values = new double[] { 4 } },
                new PieSeries<double> { Values = new double[] { 3 } }
            };
    }
}
<lvc:PieChart
    Series="{Binding Series}">
</lvc:PieChart>
InitialRotation property
Controls the angle in degrees where the first slice is drawn, the InitialRotation property will change the start angle of
the pie, the following diagram explains where the PieChart rotation starts:
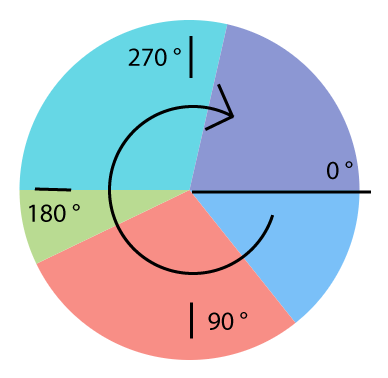
<lvc:PieChart
    InitialRotation="-90">
</lvc:PieChart>
Notice a change in the InitialRotation property is animated automatically based on the chart animations settings:
MaxAngle property
This property determines the complete angle in degrees of the chart, the default value is 360.
<lvc:PieChart
    MaxAngle="270">
</lvc:PieChart>
Notice the MaxAngle property is animated automatically based on the chart animations settings:
AnimationsSpeed property
This section uses the CartesianChart control, but it works the same in the PieChartControl control.
Defines the animations speed of all the chart elements (axes, series, sections).
<lvc:CartesianChart
    Series="{Binding Series}"
    AnimationsSpeed="00:00:00.500"> <!-- 500 milliseconds --> <!-- mark -->
</lvc:CartesianChart>
EasingFunction property
This section uses the CartesianChart control, but it works the same in the PieChartControl control.
This property defines the way the shapes in the chart animate, in other words it controls the way the IMotionProperties of all the chart elements (axes, series, sections) in the chart move from a state 'A' to state 'B'.
The property is of type Func<float, float>, it means that it is a function that takes a float argument (the time elapsed from 0 to 1),
and returns float value as the result (the progress of the animation from 0 to 1), you can learn more about easing curves at
this article.
<Container
    xmlns="http://schemas.microsoft.com/winfx/2006/xaml/presentation"
    xmlns:x="http://schemas.microsoft.com/winfx/2006/xaml"
    xmlns:lvcore="clr-namespace:LiveChartsCore;assembly=LiveChartsCore"> <!-- import the core ns --> <!-- mark -->

    <lvc:CartesianChart
        Series="{Binding Series}"
        AnimationsSpeed="00:00:00.500"
        EasingFunction="{Binding Source={x:Static lvcore:EasingFunctions.BounceOut}}"> <!-- mark -->
    </lvc:CartesianChart>

</Container>
Now the chart will animate following the BounceOut curve.
Now try the LiveChartsCore.EasingFunctions.Lineal function, it will animate things lineally as the time elapses.
Finally you can also build your own function:
public Func<float, float> Easing { get; set; } = time => time * time; // mark<Control
xmlns="http://schemas.microsoft.com/winfx/2006/xaml/presentation"
xmlns:x="http://schemas.microsoft.com/winfx/2006/xaml">
<lvc:CartesianChart
Series="{Binding Series}"
AnimationsSpeed="00:00:00.500"
EasingFunction="{Binding Easing}"> <!-- mark -->
</lvc:CartesianChart>The library also provides some builders based on d3-ease easing curves, the builders.
Func easingCurve = LiveChartsCore.EasingFunctions.BuildCustomBackOut(0.8f);
Func easingCurve = LiveChartsCore.EasingFunctions.BuildCustomElasticOut(0.8f, 1.1f);
// there are more builders, check them out all, they start with Build{ function }({ args })
Disable animations
This section uses the CartesianChart control, but it works the same in the PieChartControl control.
Settings the EasingFunction to null disables animations.
<lvc:CartesianChart
    EasingFunction="{x:Null}"> <!-- mark -->
</lvc:CartesianChart>
Disabling animations will not improve performance drastically: if you come from LiveCharts 0.x version then
maybe you are thinking that disabling animations will improve the performance of the library, in most of the cases
that is not true, animations are not the bottleneck in performance in LiveCharts 2.x, normally you need to
clean your code somewhere else, not here, plus we put a lot of effort building the animations of the library, please
just do not disable them 😭, instead try to make them run faster, animating data visualization normally brings
an excellent user experience.
DrawMargin property
This section uses the CartesianChart control, but it works the same in the PieChartControl control.
Defines the distance from the axes (or edge of the chart if there is no axis) to the draw margin area.
// Notice the constructor of the Margin class has multiple overloads
// https://livecharts.dev/api/2.0.0-rc6.1/LiveChartsCore.Measure.Margin
public LiveChartsCore.Measure.Margin Margin { get; set; } = new LiveChartsCore.Measure.Margin(100); // mark
<lvc:CartesianChart
Series="{Binding Series}"
DrawMargin="{Binding Margin}"> <!-- mark -->
</lvc:CartesianChart>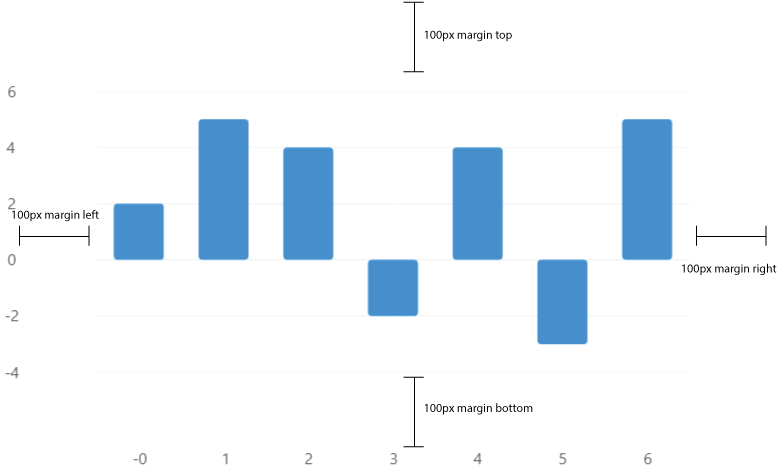
Tooltips
This section uses the CartesianChart control, but it works the same in the PieChartControl control.
Tooltips are popups that help the user to read a chart as the pointer moves.
This is a brief sample about how to use the main features of the IChartTooltip<T> interface, you can find a more detailed article at the button below or at the
API explorer.
You can place a tooltip at Top, Bottom, Left, Right, Center or Hidden positions, for now
tooltips for the PieChart class only support the Center position, default value is Top.
Notice the Hidden position will disable tooltips in a chart.
<lvc:CartesianChart
    Series="{Binding Series}"
    TooltipPosition="Top"><!-- mark -->
</lvc:CartesianChart>
<lvc:CartesianChart
    Series="{Binding Series}"
    TooltipPosition="Bottom"><!-- mark -->
</lvc:CartesianChart>
<lvc:CartesianChart
    Series="{Binding Series}"
    TooltipPosition="Left"><!-- mark -->
</lvc:CartesianChart>
<lvc:CartesianChart
    Series="{Binding Series}"
    TooltipPosition="Right"><!-- mark -->
</lvc:CartesianChart>
<lvc:CartesianChart
    Series="{Binding Series}"
    TooltipPosition="Center"><!-- mark -->
</lvc:CartesianChart>
<lvc:CartesianChart
    Series="{Binding Series}"
    TooltipPosition="Hidden"><!-- mark -->
</lvc:CartesianChart>
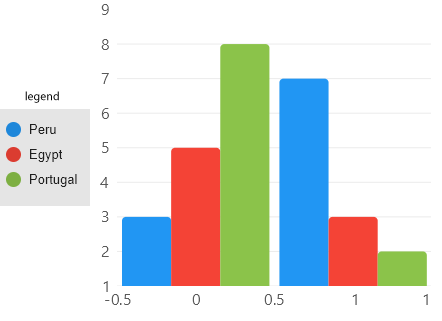
Legends
This section uses the CartesianChart control, but it works the same in the PieChartControl control.
A legend is a visual element that displays a list with the name, stroke and fills of the series in a chart:
This is a brief sample about how to use the main features of the IChartLegend<T> interface, you can find a more detailed article at the button below or at the
API explorer.
You can place a legend at Top, Bottom, Left, Right or Hidden positions, notice the Hidden position will
disable legends in a chart, default value is Hidden.
<lvc:CartesianChart
    Series="{Binding Series}"
    LegendPosition="Top"><!-- mark -->
</lvc:CartesianChart>
<lvc:CartesianChart
    Series="{Binding Series}"
    LegendPosition="Bottom"><!-- mark -->
</lvc:CartesianChart>
<lvc:CartesianChart
    Series="{Binding Series}"
    LegendPosition="Left"><!-- mark -->
</lvc:CartesianChart>
<lvc:CartesianChart
    Series="{Binding Series}"
    LegendPosition="Right"><!-- mark -->
</lvc:CartesianChart>
<lvc:CartesianChart
    Series="{Binding Series}"
    LegendPosition="Hidden"><!-- mark -->
</lvc:CartesianChart>