Conditional Draw
Code behind
using System;
using System.Collections.ObjectModel;
using System.Windows.Forms;
using LiveChartsCore;
using LiveChartsCore.Defaults;
using LiveChartsCore.Kernel;
using LiveChartsCore.SkiaSharpView;
using LiveChartsCore.SkiaSharpView.Painting;
using LiveChartsCore.SkiaSharpView.WinForms;
using SkiaSharp;
using System.Threading.Tasks;
using LiveChartsCore.VisualStates;
using LiveChartsCore.Drawing;
#pragma warning disable IDE0058 // Expression value is never used
namespace WinFormsSample.General.ConditionalDraw;
public partial class View : UserControl
{
private readonly ObservableCollection<ObservableValue> _values;
private readonly Random _random = new();
public View()
{
InitializeComponent();
Size = new System.Drawing.Size(400, 400);
_values = [
new(2),
new(3),
new(4)
];
var columnSeries = new ColumnSeries<ObservableValue>
{
ShowDataLabels = true,
DataLabelsSize = 15,
Values = _values,
};
columnSeries.PointMeasured += OnPointMeasured;
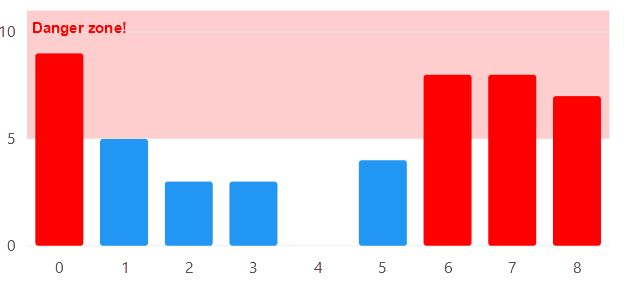
// define the danger state, a red fill.
columnSeries.HasState("Danger", [
(nameof(IDrawnElement.Fill), new SolidColorPaint(SKColors.Red))
]);
columnSeries.HasState("LabelDanger", [
(nameof(IDrawnElement.Paint), new SolidColorPaint(SKColors.Red)),
(nameof(BaseLabelGeometry.TextSize), 30f),
]);
// the hover state is fired when the mouse is over the point
columnSeries.HasState("Hover", [
(nameof(IDrawnElement.DropShadow), new LvcDropShadow(4, 4, 16, 16, new(0, 0, 255)))
]);
var cartesianChart = new CartesianChart
{
Series = [columnSeries],
TooltipPosition = LiveChartsCore.Measure.TooltipPosition.Bottom,
Location = new System.Drawing.Point(0, 0),
Size = new System.Drawing.Size(400, 400),
Anchor = AnchorStyles.Left | AnchorStyles.Right | AnchorStyles.Top | AnchorStyles.Bottom
};
Controls.Add(cartesianChart);
_ = Randomize();
}
private void OnPointMeasured(ChartPoint point)
{
var ctx = point.Context;
if (ctx.DataSource is not ObservableValue observable) return;
var states = ctx.Series.VisualStates;
if (observable.Value > 5)
{
states.SetState("Danger", ctx.Visual);
states.SetState("LabelDanger", ctx.Label);
}
else
{
states.ClearState("Danger", ctx.Visual);
states.ClearState("LabelDanger", ctx.Label);
}
}
private async Task Randomize()
{
while (true)
{
await Task.Delay(3000);
foreach (var item in _values)
{
item.Value = _random.Next(1, 10);
}
}
}
}
Articles you might also find useful: