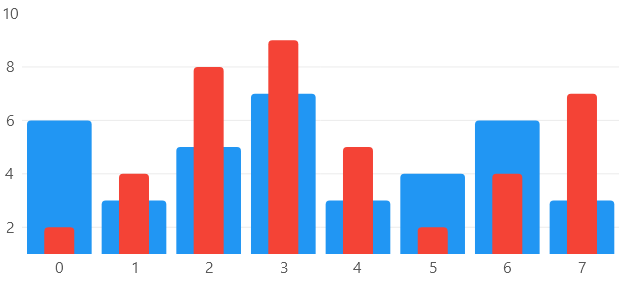
Layered Bars
Hover over the image to see the chart animation
The [ObservableObject], [ObservableProperty] and [RelayCommand] attributes come from the
CommunityToolkit.Mvvm package, you can read more about it
here.

View Model
using CommunityToolkit.Mvvm.ComponentModel;
using LiveChartsCore;
using LiveChartsCore.SkiaSharpView;

namespace ViewModelsSamples.Bars.Layered;

public partial class ViewModel : ObservableObject
{
    public ISeries[] Series { get; set; } =
    {
        new ColumnSeries<int>
        {
            Values = new[] { 6, 3, 5, 7, 3, 4, 6, 3 },
            Stroke = null,
            MaxBarWidth = double.MaxValue,
            IgnoresBarPosition = true
        },
        new ColumnSeries<int>
        {
            Values = new[] { 2, 4, 8, 9, 5, 2, 4, 7 },
            Stroke = null,
            MaxBarWidth = 30,
            IgnoresBarPosition = true
        }
    };
}
XAML
<UserControl x:Class="AvaloniaSample.Bars.Layered.View"
             xmlns="https://github.com/avaloniaui"
             xmlns:x="http://schemas.microsoft.com/winfx/2006/xaml"
             xmlns:lvc="using:LiveChartsCore.SkiaSharpView.Avalonia"
             xmlns:vms="using:ViewModelsSamples.Bars.Layered">
  <UserControl.DataContext>
    <vms:ViewModel/>
  </UserControl.DataContext>
  <Grid>
    <Grid.RowDefinitions>
      <RowDefinition Height="*"/>
    </Grid.RowDefinitions>
    <lvc:CartesianChart Series="{Binding Series}"></lvc:CartesianChart>
  </Grid>
</UserControl>