Sections
This sample uses C# 13 preview features such as partial properties, it also uses features from the CommunityToolkit.Mvvm package, you can learn more about it here.
This web site wraps every sample using a UserControl instance, but LiveCharts controls can be used inside any container.
View model
using SkiaSharp;
using LiveChartsCore.Defaults;
using LiveChartsCore.SkiaSharpView;
using LiveChartsCore.SkiaSharpView.Painting;
using LiveChartsCore.SkiaSharpView.Painting.Effects;
namespace ViewModelsSamples.General.Sections2;
public class ViewModel
{
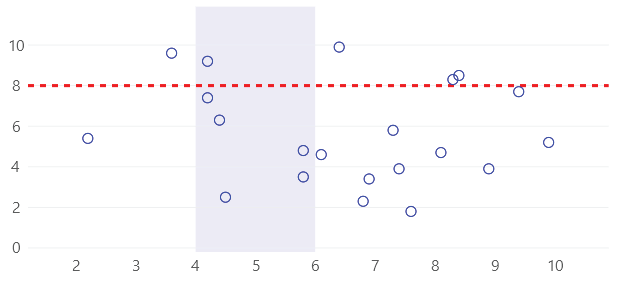
public ObservablePoint[] Values { get; set; } = [
new(2.2, 5.4), new(4.5, 2.5), new(4.2, 7.4),
new(6.4, 9.9), new(4.2, 9.2), new(5.8, 3.5),
new(7.3, 5.8), new(8.9, 3.9), new(6.1, 4.6),
new(9.4, 7.7), new(8.4, 8.5), new(3.6, 9.6),
new(4.4, 6.3), new(5.8, 4.8), new(6.9, 3.4),
new(7.6, 1.8), new(8.3, 8.3), new(9.9, 5.2),
new(8.1, 4.7), new(7.4, 3.9), new(6.8, 2.3)
];
public RectangularSection[] Sections { get; set; } = [
new RectangularSection
{
Yi = 8,
Yj = 8,
Stroke = new SolidColorPaint
{
Color = SKColors.Red,
StrokeThickness = 3,
PathEffect = new DashEffect([6, 6])
}
},
new RectangularSection
{
Xi = 4,
Xj = 6,
Fill = new SolidColorPaint(SKColors.Blue.WithAlpha(20))
},
];
}
XAML
<UserControl
    x:Class="AvaloniaSample.General.Sections2.View"
    xmlns="https://github.com/avaloniaui"
    xmlns:x="http://schemas.microsoft.com/winfx/2006/xaml"
    xmlns:lvc="using:LiveChartsCore.SkiaSharpView.Avalonia"
    xmlns:vms="using:ViewModelsSamples.General.Sections2"
    x:DataType="vms:ViewModel">

    <UserControl.DataContext>
        <vms:ViewModel/>
    </UserControl.DataContext>

    <lvc:CartesianChart>

        <lvc:CartesianChart.Series>
            <lvc:XamlScatterSeries
                Values="{Binding Values}"
                GeometrySize="10"
                Stroke="{lvc:SolidColorPaint Color='#00f'}"
                Fill="{x:Null}"/>
        </lvc:CartesianChart.Series>

        <lvc:CartesianChart.Sections>
            <lvc:XamlRectangularSection
                Yi="8"
                Yj="8"
                Stroke="{lvc:SolidColorPaint
                    Color='#F00',
                    StrokeWidth=3,
                    PathEffect={lvc:Dashed Array='6, 6'}}"/>

            <lvc:XamlRectangularSection
                Xi="6"
                Xj="8"
                Fill="{lvc:SolidColorPaint Color='#300000FF'}"/>
        </lvc:CartesianChart.Sections>
    </lvc:CartesianChart>

</UserControl>