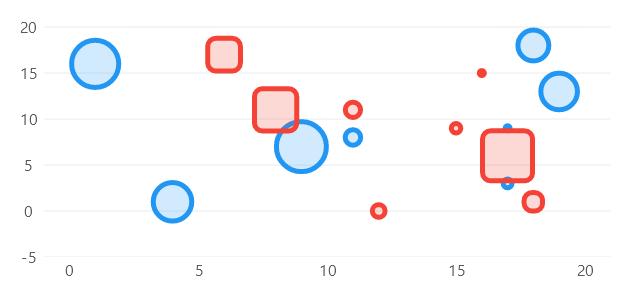
Bubbles Or Weigthed Series
This sample uses C# 13 preview features such as partial properties, it also uses features from the CommunityToolkit.Mvvm package, you can learn more about it here.
This web site wraps every sample using a UserControl instance, but LiveCharts controls can be used inside any container.
View model
using System;
using LiveChartsCore.Defaults;

namespace ViewModelsSamples.Scatter.Bubbles;

public class ViewModel
{
    private static readonly Random s_r = new();

    public WeightedPoint[] Values1 { get; set; } = Fetch(1);

    public WeightedPoint[] Values2 { get; set; } = Fetch(10);

    public WeightedPoint[] Values3 { get; set; } = Fetch(10);

    private static WeightedPoint[] Fetch(int scale)
    {
        var length = 10;
        var values = new WeightedPoint[length];

        for (var i = 0; i < length; i++)
        {
            // the WeightedPoint has 3 properties, X, Y and Weight
            // we use the X and Y coordinates to position the point in the chart
            // the weight will be used by the library to define the size of the points

            // where the minimum weight will be the smallest point, and the max weight the biggest

            // for any weight between these limits the library
            // will interpolate lineally to determine the size of each point

            var x = s_r.Next(0, 20);
            var y = s_r.Next(0, 20);
            var w = s_r.Next(0, 100) * scale;

            values[i] = new WeightedPoint(x, y, w);
        }

        return values;
    }
}
XAML
<UserControl
    x:Class="AvaloniaSample.Scatter.Bubbles.View"
    xmlns="https://github.com/avaloniaui"
    xmlns:x="http://schemas.microsoft.com/winfx/2006/xaml"
    xmlns:lvc="using:LiveChartsCore.SkiaSharpView.Avalonia"
    xmlns:vms="using:ViewModelsSamples.Scatter.Bubbles"
    x:DataType="vms:ViewModel">

    <UserControl.DataContext>
        <vms:ViewModel/>
    </UserControl.DataContext>

    <lvc:CartesianChart>
        <lvc:CartesianChart.Series>

            <lvc:XamlScatterSeries
                Values="{Binding Values1}"
                GeometrySize="100"
                MinGeometrySize="5"/>

            <!--
                The StackGroup property defines the series that
                share the weight scale.
            -->

            <lvc:XamlScatterSeries
                Values="{Binding Values2}"
                GeometrySize="100"
                MinGeometrySize="5"
                StackGroup="1"/>

            <lvc:XamlScatterSeries
                Values="{Binding Values3}"
                GeometrySize="100"
                MinGeometrySize="5"
                StackGroup="1"/>

        </lvc:CartesianChart.Series>
    </lvc:CartesianChart>

</UserControl>