Date Time Scale
View model
using System;
using System.Collections.ObjectModel;
using CommunityToolkit.Mvvm.ComponentModel;
using LiveChartsCore;
using LiveChartsCore.Defaults;
using LiveChartsCore.SkiaSharpView;
namespace ViewModelsSamples.Axes.DateTimeScaled;
public partial class ViewModel : ObservableObject
{
public ISeries[] Series { get; set; } =
{
new ColumnSeries<DateTimePoint>
{
Values = new ObservableCollection<DateTimePoint>
{
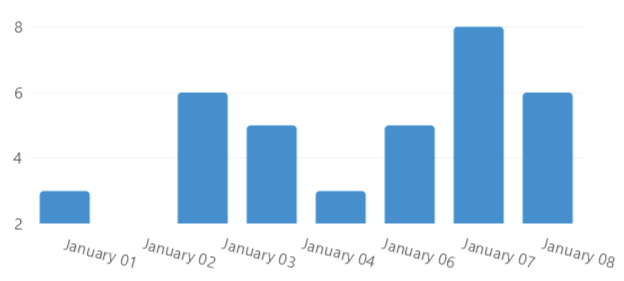
new DateTimePoint(new DateTime(2021, 1, 1), 3),
new DateTimePoint(new DateTime(2021, 1, 2), 6),
new DateTimePoint(new DateTime(2021, 1, 3), 5),
new DateTimePoint(new DateTime(2021, 1, 4), 3),
new DateTimePoint(new DateTime(2021, 1, 5), 5),
new DateTimePoint(new DateTime(2021, 1, 6), 8),
new DateTimePoint(new DateTime(2021, 1, 7), 6)
}
}
};
// You can use the DateTimeAxis class to define a date time based axis // mark
// The first parameter is the time between each point, in this case 1 day // mark
// you can also use 1 year, 1 month, 1 hour, 1 minute, 1 second, 1 millisecond, etc // mark
// The second parameter is a function that receives the value and returns the label // mark
public Axis[] XAxes { get; set; } =
{
new DateTimeAxis(TimeSpan.FromDays(1), date => date.ToString("MMMM dd"))
};
}
HTML
@page "/Axes/DateTimeScaled"
@using LiveChartsCore.SkiaSharpView.Blazor
@using ViewModelsSamples.Axes.DateTimeScaled

<CartesianChart
	Series="ViewModel.Series"
	XAxes="ViewModel.XAxes">
</CartesianChart>

@code {
	public ViewModel ViewModel { get; set; } = new();
}
Articles you might also find useful: