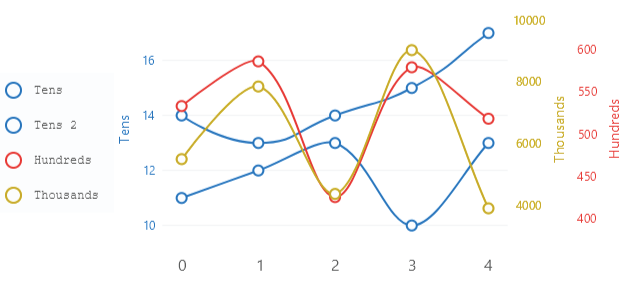
Multiple Axes
View model
using CommunityToolkit.Mvvm.ComponentModel;
using LiveChartsCore;
using LiveChartsCore.Kernel.Sketches;
using LiveChartsCore.SkiaSharpView;
using LiveChartsCore.SkiaSharpView.Painting;
using SkiaSharp;

namespace ViewModelsSamples.Axes.Multiple;

public partial class ViewModel : ObservableObject
{
    private static readonly SKColor s_blue = new(25, 118, 210);
    private static readonly SKColor s_red = new(229, 57, 53);
    private static readonly SKColor s_yellow = new(198, 167, 0);

    public ISeries[] Series { get; set; } =
    {
        new LineSeries<double>
        {
            LineSmoothness = 1,
            Name = "Tens",
            Values = new double[] { 14, 13, 14, 15, 17 },
            Stroke = new SolidColorPaint(s_blue, 2),
            GeometrySize = 10,
            GeometryStroke = new SolidColorPaint(s_blue, 2),
            Fill = null,
            ScalesYAt = 0 // it will be scaled at the Axis[0] instance // mark
        },
        new LineSeries<double>
        {
            Name = "Tens 2",
            Values = new double[] { 11, 12, 13, 10, 13 },
            Stroke = new SolidColorPaint(s_blue, 2),
            GeometrySize = 10,
            GeometryStroke = new SolidColorPaint(s_blue, 2),
            Fill = null,
            ScalesYAt = 0 // it will be scaled at the Axis[0] instance // mark
        },
        new LineSeries<double>
        {
            Name = "Hundreds",
            Values = new double[] { 533, 586, 425, 579, 518 },
            Stroke = new SolidColorPaint(s_red, 2),
            GeometrySize = 10,
            GeometryStroke = new SolidColorPaint(s_red, 2),
            Fill = null,
            ScalesYAt = 1 // it will be scaled at the YAxes[1] instance // mark
        },
        new LineSeries<double>
        {
            Name = "Thousands",
            Values = new double[] { 5493, 7843, 4368, 9018, 3902 },
            Stroke = new SolidColorPaint(s_yellow, 2),
            GeometrySize = 10,
            GeometryStroke = new SolidColorPaint(s_yellow, 2),
            Fill = null,
            ScalesYAt = 2  // it will be scaled at the YAxes[2] instance // mark
        }
    };

    public ICartesianAxis[] YAxes { get; set; } =
    {
        new Axis // the "units" and "tens" series will be scaled on this axis
        {
            Name = "Tens",
            NameTextSize = 14,
            NamePaint = new SolidColorPaint(s_blue),
            NamePadding = new LiveChartsCore.Drawing.Padding(0, 20),
            Padding =  new LiveChartsCore.Drawing.Padding(0, 0, 20, 0),
            TextSize = 12,
            LabelsPaint = new SolidColorPaint(s_blue),
            TicksPaint = new SolidColorPaint(s_blue),
            SubticksPaint = new SolidColorPaint(s_blue),
            DrawTicksPath = true
        },
        new Axis // the "hundreds" series will be scaled on this axis
        {
            Name = "Hundreds",
            NameTextSize = 14,
            NamePaint = new SolidColorPaint(s_red),
            NamePadding = new LiveChartsCore.Drawing.Padding(0, 20),
            Padding =  new LiveChartsCore.Drawing.Padding(20, 0, 0, 0),
            TextSize = 12,
            LabelsPaint = new SolidColorPaint(s_red),
            TicksPaint = new SolidColorPaint(s_red),
            SubticksPaint = new SolidColorPaint(s_red),
            DrawTicksPath = true,
            ShowSeparatorLines = false,
            Position = LiveChartsCore.Measure.AxisPosition.End
        },
        new Axis // the "thousands" series will be scaled on this axis
        {
            Name = "Thousands",
            NameTextSize = 14,
            NamePadding = new LiveChartsCore.Drawing.Padding(0, 20),
            Padding =  new LiveChartsCore.Drawing.Padding(20, 0, 0, 0),
            NamePaint = new SolidColorPaint(s_yellow),
            TextSize = 12,
            LabelsPaint = new SolidColorPaint(s_yellow),
            TicksPaint = new SolidColorPaint(s_yellow),
            SubticksPaint = new SolidColorPaint(s_yellow),
            DrawTicksPath = true,
            ShowSeparatorLines = false,
            Position = LiveChartsCore.Measure.AxisPosition.End
        }
    };

    public SolidColorPaint LegendTextPaint { get; set; } =
        new SolidColorPaint
        {
            Color = new SKColor(50, 50, 50),
            SKTypeface = SKTypeface.FromFamilyName("Courier New")
        };

    public SolidColorPaint LedgendBackgroundPaint { get; set; } =
        new SolidColorPaint(new SKColor(240, 240, 240));
}
HTML
@page "/Axes/Multiple"
@using LiveChartsCore.SkiaSharpView.Blazor
@using ViewModelsSamples.Axes.Multiple

<CartesianChart
	Series="ViewModel.Series"
	YAxes="ViewModel.YAxes"
	LegendPosition="LiveChartsCore.Measure.LegendPosition.Left"
    LegendBackgroundPaint="ViewModel.LedgendBackgroundPaint"
    LegendTextPaint="ViewModel.LegendTextPaint"
    LegendTextSize="16">
</CartesianChart>

@code {
	public ViewModel ViewModel { get; set; } = new();
}
Articles you might also find useful: