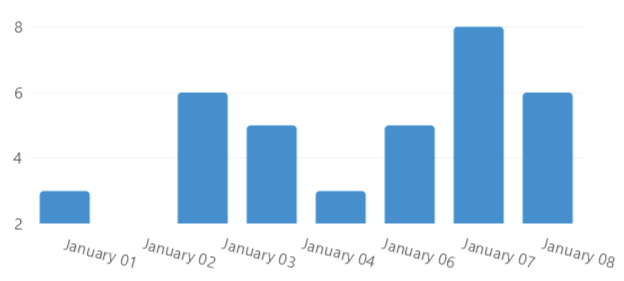
Date Time Scale
View model
using System;
using LiveChartsCore;
using LiveChartsCore.Defaults;
using LiveChartsCore.Kernel.Sketches;
using LiveChartsCore.SkiaSharpView;

namespace ViewModelsSamples.Axes.DateTimeScaled;

public class ViewModel
{
    public ISeries[] Series { get; set; } = [
        new ColumnSeries<DateTimePoint>
        {
            Values = [
                new() { DateTime = new(2021, 1, 1), Value = 3 },
                new() { DateTime = new(2021, 1, 2), Value = 6 },
                new() { DateTime = new(2021, 1, 3), Value = 5 },
                new() { DateTime = new(2021, 1, 4), Value = 3 },
                new() { DateTime = new(2021, 1, 5), Value = 5 },
                new() { DateTime = new(2021, 1, 6), Value = 8 },
                new() { DateTime = new(2021, 1, 7), Value = 6 }
            ]
        }
    ];

    // You can use the DateTimeAxis class to define a date time based axis // mark

    // The first parameter is the time between each point, in this case 1 day // mark
    // you can also use 1 year, 1 month, 1 hour, 1 minute, 1 second, 1 millisecond, etc // mark

    // The second parameter is a function that receives a date and returns the label as string // mark
    public ICartesianAxis[] XAxes { get; set; } = [
        new DateTimeAxis(TimeSpan.FromDays(1), date => date.ToString("MMMM dd"))
    ];
}
HTML
@page "/Axes/DateTimeScaled"
@using LiveChartsCore.SkiaSharpView.Blazor
@using ViewModelsSamples.Axes.DateTimeScaled

<CartesianChart
	Series="ViewModel.Series"
	XAxes="ViewModel.XAxes">
</CartesianChart>

@code {
	public ViewModel ViewModel { get; set; } = new();
}
Articles you might also find useful: