Time Span Scale
View model
using System;
using System.Collections.ObjectModel;
using CommunityToolkit.Mvvm.ComponentModel;
using LiveChartsCore;
using LiveChartsCore.Defaults;
using LiveChartsCore.SkiaSharpView;
namespace ViewModelsSamples.Axes.TimeSpanScaled;
public partial class ViewModel : ObservableObject
{
public ISeries[] Series { get; set; } =
{
new ColumnSeries<TimeSpanPoint>
{
Values = new ObservableCollection<TimeSpanPoint>
{
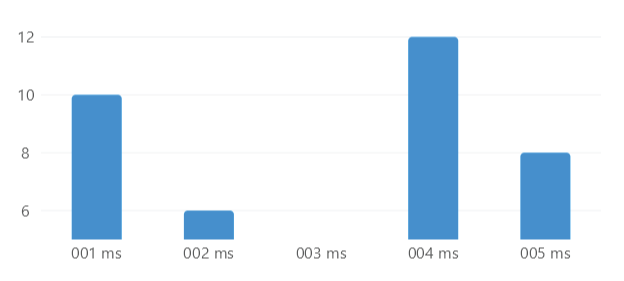
new TimeSpanPoint(TimeSpan.FromMilliseconds(1), 10),
new TimeSpanPoint(TimeSpan.FromMilliseconds(2), 6),
// new TimeSpanPoint(TimeSpan.FromMilliseconds(3), 3),
new TimeSpanPoint(TimeSpan.FromMilliseconds(4), 12),
new TimeSpanPoint(TimeSpan.FromMilliseconds(5), 8),
},
}
};
public Axis[] XAxes { get; set; } =
{
new Axis
{
Labeler = value => value.AsTimeSpan().ToString("fff") + " ms",
// when using a date time type, let the library know your unit // mark
UnitWidth = TimeSpan.FromMilliseconds(1).Ticks, //mark
// if the difference between our points is in hours then we would:
// UnitWidth = TimeSpan.FromHours(1).Ticks,
// since all the months and years have a different number of days
// we can use the average, it would not cause any visible error in the user interface
// Months: TimeSpan.FromDays(30.4375).Ticks
// Years: TimeSpan.FromDays(365.25).Ticks
// The MinStep property forces the separator to be greater than 1 ms.
MinStep = TimeSpan.FromMilliseconds(1).Ticks, // mark
}
};
}
using Eto.Forms;
using LiveChartsCore.SkiaSharpView.Eto;
using ViewModelsSamples.Axes.TimeSpanScaled;

namespace EtoFormsSample.Axes.TimeSpanScaled;

public class View : Panel
{
    private readonly CartesianChart cartesianChart;

    public View()
    {
        var viewModel = new ViewModel();

        cartesianChart = new CartesianChart
        {
            Series = viewModel.Series,
            XAxes = viewModel.XAxes,
        };

        Content = cartesianChart;
    }
}
Articles you might also find useful: