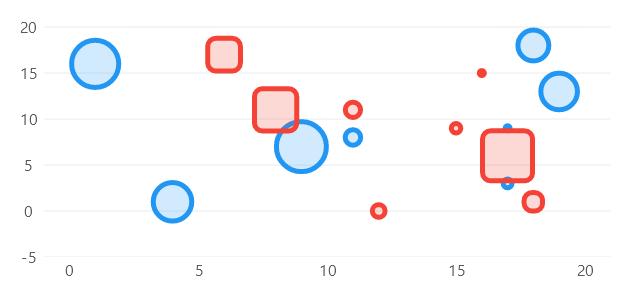
Bubbles Or Weigthed Series
View model
using System;
using System.Collections.ObjectModel;
using LiveChartsCore;
using LiveChartsCore.Defaults;
using LiveChartsCore.SkiaSharpView;
using LiveChartsCore.SkiaSharpView.Drawing.Geometries;
using CommunityToolkit.Mvvm.ComponentModel;

namespace ViewModelsSamples.Scatter.Bubbles;

public partial class ViewModel : ObservableObject
{
    public ViewModel()
    {
        var r = new Random();
        var values1 = new ObservableCollection<WeightedPoint>();
        var values2 = new ObservableCollection<WeightedPoint>();

        for (var i = 0; i < 8; i++)
        {
            // the WeightedPoint has 3 properties, X, Y and Weight
            // we use the X and Y coordinates to position the point in the chart
            // the weight will be used by the library to define the size of the points

            // where the minimum weight will be the smallest point, and the max weight the biggest

            // for any weight between these limits the library
            // will interpolate lineally to determine the size of each point

            var x = r.Next(0, 20);
            var y = r.Next(0, 20);
            var w = r.Next(0, 100);

            values1.Add(new WeightedPoint(x, y, w));

            // we do the same for our seconds values collection.
            values2.Add(new WeightedPoint(r.Next(0, 20), r.Next(0, 20), r.Next(0, 100)));
        }

        Series = new ISeries[]
        {
            new ScatterSeries<WeightedPoint>
            {
                Values = values1,
                GeometrySize = 50,
                MinGeometrySize = 5
            },
            new ScatterSeries<WeightedPoint, RoundedRectangleGeometry>
            {
                Values = values2,
                GeometrySize = 50,
                MinGeometrySize = 5
            }
        };
    }

    public ISeries[] Series { get; set; }
}
using Eto.Forms;
using LiveChartsCore.SkiaSharpView.Eto;
using ViewModelsSamples.Scatter.Bubbles;

namespace EtoFormsSample.Scatter.Bubbles;

public class View : Panel
{
    private readonly CartesianChart cartesianChart;

    public View()
    {
        var viewModel = new ViewModel();

        cartesianChart = new CartesianChart
        {
            Series = viewModel.Series,
        };

        Content = cartesianChart;
    }
}
Articles you might also find useful: