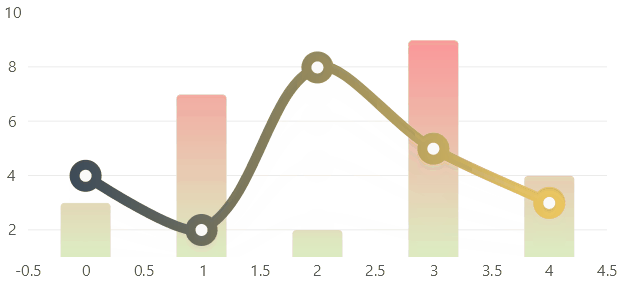
Linear Gradients
Hover over the image to see the chart animation
View Model
using CommunityToolkit.Mvvm.ComponentModel;
using LiveChartsCore;
using LiveChartsCore.SkiaSharpView;
using LiveChartsCore.SkiaSharpView.Painting;
using SkiaSharp;

namespace ViewModelsSamples.Design.LinearGradients;

public partial class ViewModel : ObservableObject
{
    // linear gradients are based on SkiaSharp linear gradients
    // for more info please see:
    // https://docs.microsoft.com/en-us/xamarin/xamarin-forms/user-interface/graphics/skiasharp/effects/shaders/linear-gradient

    public ISeries[] Series { get; set; } = new ISeries[]
    {
        new ColumnSeries<int>
        {
            Name = "John",
            Values = new []{ 3, 7, 2, 9, 4 },
            Stroke = null,

            // this is an easy way to set a linear gradient:
            // Fill = new LinearGradientPaint(new SKColor(255, 140, 148), new SKColor(220, 237, 194))

            // but you can customize the gradient
            Fill = new LinearGradientPaint(
                // the gradient will use the following colors array
                new [] { new SKColor(255, 140, 148), new SKColor(220, 237, 194) },

                // now with the following points we are specifying the orientation of the gradient
                // by default the gradient is orientated horizontally
                // defined by the points: (0, 0.5) and (1, 0.5)
                // but for this sample we will use a vertical gradient:

                // to build a vertical gradient we must specify 2 points that will draw a imaginary line
                // the gradient will interpolate colors lineally as it moves following this imaginary line
                // the coordinates of these points (X, Y) go from 0 to 1
                // where 0 is the start of the axis and 1 the end. Then to build our vertical gradient

                // we must go from the point:
                // (x0, y0) where x0 could be read as "the middle of the x axis" (0.5) and y0 as "the start of the y axis" (0)
                new SKPoint(0.5f, 0),

                // to the point:
                // (x1, y1) where x1 could be read as "the middle of the x axis" (0.5) and y0 as "the end of the y axis" (1)
                new SKPoint(0.5f, 1))
        },
        new LineSeries<int>
        {
            Name = "Charles",
            Values = new []{ 4, 2, 8, 5, 3 },
            GeometrySize = 22,
            Stroke = new LinearGradientPaint(new[]{ new SKColor(45, 64, 89), new SKColor(255, 212, 96)}) { StrokeThickness = 10 },
            GeometryStroke = new LinearGradientPaint(new[]{ new SKColor(45, 64, 89), new SKColor(255, 212, 96)}) { StrokeThickness = 10 },
            Fill = null
        }
    };
}
using Eto.Forms;
using LiveChartsCore.SkiaSharpView.Eto;
using ViewModelsSamples.Design.LinearGradients;

namespace EtoFormsSample.Design.LinearGradients;

public class View : Panel
{
    private readonly CartesianChart cartesianChart;

    public View()
    {
        var viewModel = new ViewModel();

        cartesianChart = new CartesianChart
        {
            Series = viewModel.Series,
            LegendPosition = LiveChartsCore.Measure.LegendPosition.Right,
        };

        Content = cartesianChart;
    }
}