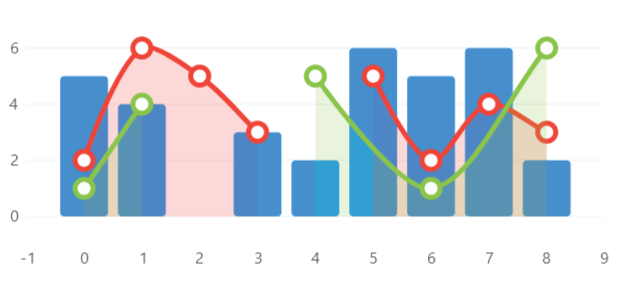
Gaps/Null Points

Hover over the image to see the chart animation
View Model
using LiveChartsCore;
using LiveChartsCore.Defaults;
using LiveChartsCore.SkiaSharpView;

namespace ViewModelsSamples.General.NullPoints;

public class ViewModel
{
    public ISeries[] Series { get; set; } = [
        new ColumnSeries<double?>
        {
            Values = [5, 4, null, 3, 2, 6, 5, 6, 2]
        },
        new LineSeries<double?>
        {
            Values = [2, 6, 5, 3, null, 5, 2, 4, null]
        },
        new LineSeries<ObservablePoint?>
        {
            Values = [
                new ObservablePoint { X = 0, Y = 1 },
                new ObservablePoint { X = 1, Y = 4 },
                null,
                new ObservablePoint { X = 4, Y = 5 },
                new ObservablePoint { X = 6, Y = 1 },
                new ObservablePoint { X = 8, Y = 6 },
            ]
        }
    ];
}
using Eto.Forms;
using LiveChartsCore.SkiaSharpView.Eto;
using ViewModelsSamples.General.NullPoints;

namespace EtoFormsSample.General.NullPoints;

public class View : Panel
{
    private readonly CartesianChart cartesianChart;

    public View()
    {
        var viewModel = new ViewModel();

        cartesianChart = new CartesianChart
        {
            Series = viewModel.Series,
        };

        Content = cartesianChart;
    }
}