Sections
Code behind
using Eto.Forms;
using LiveChartsCore;
using LiveChartsCore.Defaults;
using LiveChartsCore.SkiaSharpView;
using LiveChartsCore.SkiaSharpView.Eto;
using LiveChartsCore.SkiaSharpView.Painting;
using SkiaSharp;
namespace EtoFormsSample.General.Sections2;
public class View : Panel
{
public View()
{
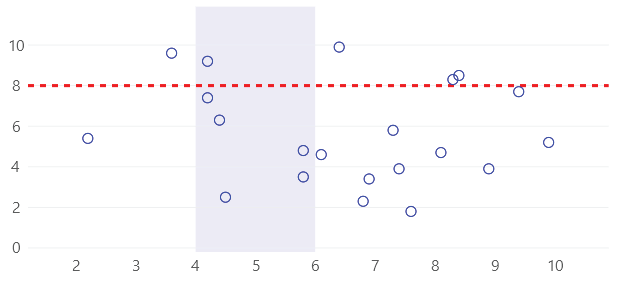
var values = new ObservablePoint[]
{
new(2.2, 5.4), new(4.5, 2.5), new(4.2, 7.4),
new(6.4, 9.9), new(4.2, 9.2), new(5.8, 3.5),
new(7.3, 5.8), new(8.9, 3.9), new(6.1, 4.6),
new(9.4, 7.7), new(8.4, 8.5), new(3.6, 9.6),
new(4.4, 6.3), new(5.8, 4.8), new(6.9, 3.4),
new(7.6, 1.8), new(8.3, 8.3), new(9.9, 5.2),
new(8.1, 4.7), new(7.4, 3.9), new(6.8, 2.3)
};
var series = new ISeries[]
{
new ScatterSeries<ObservablePoint>
{
Values = values,
GeometrySize = 10,
Stroke = new SolidColorPaint(SKColor.Parse("#00f")),
Fill = null
}
};
var sections = new RectangularSection[]
{
new() {
Yi = 8,
Yj = 8,
Stroke = new SolidColorPaint
{
Color = SKColor.Parse("#F00"),
StrokeThickness = 3,
PathEffect = new LiveChartsCore.SkiaSharpView.Painting.Effects.DashEffect(new float[] {6, 6})
}
},
new() {
Xi = 6,
Xj = 8,
Fill = new SolidColorPaint(SKColor.Parse("#300000FF"))
}
};
var cartesianChart = new CartesianChart
{
Series = series,
Sections = sections,
};
Content = cartesianChart;
}
}
Articles you might also find useful: