Logarithmic Scale
LogarithmicPoint.cs
namespace ViewModelsSamples.Axes.Logarithmic;

public class LogarithmicPoint(double x, double y)
{
    public double X { get; set; } = x;
    public double Y { get; set; } = y;
}
Code behind
using System;
using Eto.Forms;
using LiveChartsCore;
using LiveChartsCore.SkiaSharpView;
using LiveChartsCore.SkiaSharpView.Eto;
using LiveChartsCore.SkiaSharpView.Painting;
using SkiaSharp;
using ViewModelsSamples.Axes.Logarithmic;
namespace EtoFormsSample.Axes.Logarithmic;
public class View : Panel
{
private readonly CartesianChart cartesianChart;
public View()
{
var logBase = 10d;
// register the logarithmic point mapper
LiveCharts.Configure(config =>
config.HasMap<LogarithmicPoint>(
(logPoint, index) => new(logPoint.X, Math.Log(logPoint.Y, logBase))));
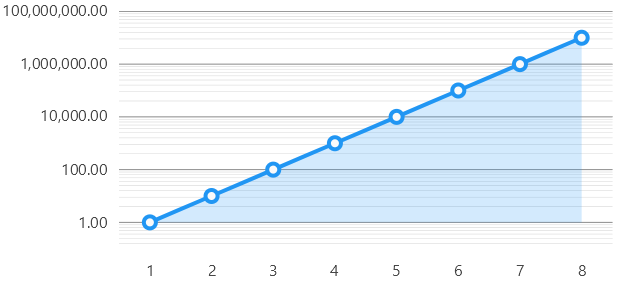
var values = new LogarithmicPoint[]
{
new(1, 1),
new(2, 10),
new(3, 100),
new(4, 1000),
new(5, 10000),
new(6, 100000),
new(7, 1000000),
new(8, 10000000)
};
var series = new ISeries[]
{
new LineSeries<LogarithmicPoint> { Values = values }
};
var yAxis = new LogarithmicAxis(logBase)
{
SeparatorsPaint = new SolidColorPaint(SKColors.LightSlateGray),
SubseparatorsPaint = new SolidColorPaint(SKColors.LightSlateGray) { StrokeThickness = 0.5f },
SubseparatorsCount = 9
};
cartesianChart = new CartesianChart
{
Series = series,
YAxes = [yAxis],
};
Content = cartesianChart;
}
}
Articles you might also find useful: