~/cartesianChart/legends.md
Legends
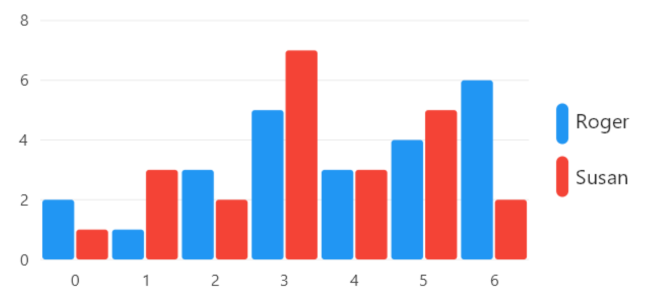
A legend is a visual element that displays a list with the name, stroke and fills of the series in a chart:
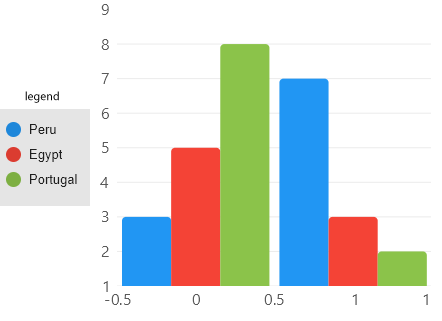
You can place a legend at Top, Bottom, Left, Right or Hidden positions, notice the Hidden position will
disable legends in a chart, default value is Hidden.
cartesianChart1.LegendPosition = LiveChartsCore.Measure.LegendPosition.Bottom; // mark
// or use Top, Left, Right or Hidden
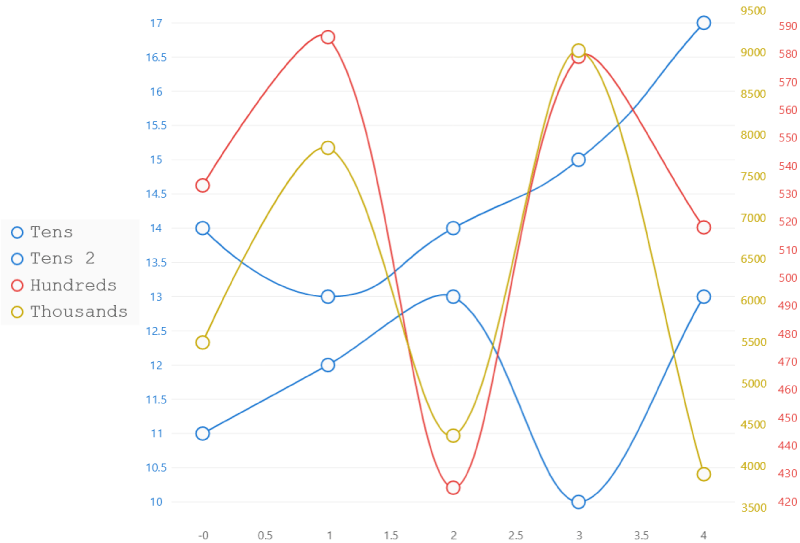
Customize default legends
You can quickly change the position, the font, the text size or the background color:
using System.Windows.Forms;
using LiveChartsCore.SkiaSharpView.WinForms;
using ViewModelsSamples.Axes.Multiple;

namespace WinFormsSample.Axes.Multiple;

public partial class View : UserControl
{
    private readonly CartesianChart cartesianChart;

    public View()
    {
        InitializeComponent();
        Size = new System.Drawing.Size(50, 50);

        var viewModel = new ViewModel();

        cartesianChart = new CartesianChart
        {
            Series = viewModel.Series,
            YAxes = viewModel.YAxes,
            LegendPosition = LiveChartsCore.Measure.LegendPosition.Left,
            LegendTextPaint = viewModel.LegendTextPaint,
            LegendBackgroundPaint = viewModel.LedgendBackgroundPaint,
            LegendTextSize = 16,

            // out of livecharts properties...
            Location = new System.Drawing.Point(0, 0),
            Size = new System.Drawing.Size(50, 50),
            Anchor = AnchorStyles.Left | AnchorStyles.Right | AnchorStyles.Top | AnchorStyles.Bottom
        };

        Controls.Add(cartesianChart);
    }
}
View model
[ObservableObject]
public partial class ViewModel
{
    public ISeries[] Series { get; set; } = { ... };
    public Axis[] YAxes { get; set; } = { ... };

    public SolidColorPaint LegendTextPaint { get; set; } = // mark
        new SolidColorPaint // mark
        { // mark
            Color = new SKColor(50, 50, 50), // mark
            SKTypeface = SKTypeface.FromFamilyName("Courier New") // mark
        }; // mark

    public SolidColorPaint LedgendBackgroundPaint { get; set; } = // mark
        new SolidColorPaint(new SKColor(240, 240, 240)); // mark
}
Tooltip control from scratch
You can also create your own legend, the recommended way is to use the LiveCharts API (example bellow) but you can
use anything as tooltip as soon as it implements the IChartLegend<T> interface. At the following example we build
a custom control to render legends in our charts using the LiveCharts API.
CustomLegend.cs
using LiveChartsCore;
using LiveChartsCore.Drawing;
using LiveChartsCore.Kernel.Sketches;
using LiveChartsCore.Measure;
using LiveChartsCore.SkiaSharpView;
using LiveChartsCore.SkiaSharpView.Drawing;
using LiveChartsCore.SkiaSharpView.Drawing.Geometries;
using LiveChartsCore.SkiaSharpView.Painting;
using LiveChartsCore.SkiaSharpView.VisualElements;
using LiveChartsCore.VisualElements;
using SkiaSharp;

namespace ViewModelsSamples.General.TemplatedLegends;

public class CustomLegend : IChartLegend<SkiaSharpDrawingContext>
{
    private static readonly int s_zIndex = 10050;
    private readonly StackPanel<RoundedRectangleGeometry, SkiaSharpDrawingContext> _stackPanel = new();
    private readonly SolidColorPaint _fontPaint = new(new SKColor(30, 20, 30))
    {
        SKTypeface = SKTypeface.FromFamilyName("Arial", SKFontStyle.Bold),
        ZIndex = s_zIndex + 1
    };

    public void Draw(Chart<SkiaSharpDrawingContext> chart)
    {
        var legendPosition = chart.GetLegendPosition();

        _stackPanel.X = legendPosition.X;
        _stackPanel.Y = legendPosition.Y;

        chart.AddVisual(_stackPanel);
        if (chart.LegendPosition == LegendPosition.Hidden) chart.RemoveVisual(_stackPanel);
    }

    public LvcSize Measure(Chart<SkiaSharpDrawingContext> chart)
    {
        _stackPanel.Orientation = ContainerOrientation.Vertical;
        _stackPanel.MaxWidth = double.MaxValue;
        _stackPanel.MaxHeight = chart.ControlSize.Height;

        // clear the previous elements.
        foreach (var visual in _stackPanel.Children.ToArray())
        {
            _ = _stackPanel.Children.Remove(visual);
            chart.RemoveVisual(visual);
        }

        var theme = LiveCharts.DefaultSettings.GetTheme<SkiaSharpDrawingContext>();

        foreach (var series in chart.ChartSeries)
        {
            if (!series.IsVisibleAtLegend) continue;

            _stackPanel.Children.Add(new StackPanel<RectangleGeometry, SkiaSharpDrawingContext>
            {
                Padding = new Padding(12, 6),
                VerticalAlignment = Align.Middle,
                HorizontalAlignment = Align.Middle,
                Children =
                {
                    new SVGVisual
                    {
                        Path = SKPath.ParseSvgPathData(SVGPoints.Star),
                        Width = 25,
                        Height = 25,
                        Fill = new SolidColorPaint(theme.GetSeriesColor(series).AsSKColor())
                        {
                            ZIndex = s_zIndex + 1
                        }
                    },
                    new LabelVisual
                    {
                        Text = series.Name ?? string.Empty,
                        Paint = _fontPaint,
                        TextSize = 15,
                        Padding = new Padding(8, 0, 0, 0),
                        VerticalAlignment = Align.Start,
                        HorizontalAlignment = Align.Start
                    }
                }
            });
        }

        return _stackPanel.Measure(chart);
    }
}
View
using System.Windows.Forms;
using LiveChartsCore.SkiaSharpView.WinForms;
using ViewModelsSamples.General.TemplatedLegends;

namespace WinFormsSample.General.TemplatedLegends;

public partial class View : UserControl
{
    private readonly CartesianChart cartesianChart;

    public View()
    {
        InitializeComponent();
        Size = new System.Drawing.Size(50, 50);

        var viewModel = new ViewModel();

        cartesianChart = new CartesianChart
        {
            Series = viewModel.Series,
            LegendPosition = LiveChartsCore.Measure.LegendPosition.Right,
            Legend = new CustomLegend(),

            // out of livecharts properties...
            Location = new System.Drawing.Point(0, 0),
            Size = new System.Drawing.Size(50, 50),
            Anchor = AnchorStyles.Left | AnchorStyles.Right | AnchorStyles.Top | AnchorStyles.Bottom
        };

        Controls.Add(cartesianChart);
    }
}