Axis Labels
This web site builds the control from code behind but you could also grab it from the toolbox, this sample also uses a ViewModel to populate the properties of the control(s) in this sample.
View model
using CommunityToolkit.Mvvm.ComponentModel;
using LiveChartsCore;
using LiveChartsCore.SkiaSharpView;
using LiveChartsCore.SkiaSharpView.Painting;
using SkiaSharp;
namespace ViewModelsSamples.Axes.LabelsFormat;
public partial class ViewModel : ObservableObject
{
public ISeries[] Series { get; set; } =
{
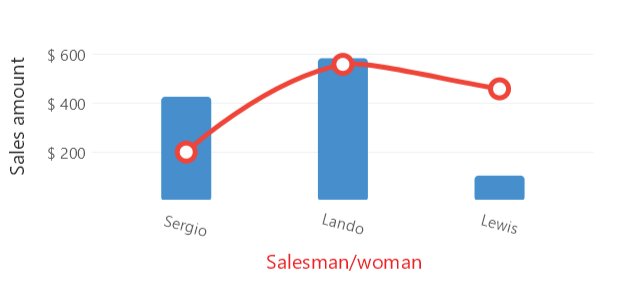
new ColumnSeries<double> { Values = new double[] { 426, 583, 104 } },
new LineSeries<double> { Values = new double[] { 200, 558, 458 }, Fill = null },
};
public Axis[] XAxes { get; set; } =
{
new Axis
{
Name = "Salesman/woman",
// Use the labels property for named or static labels // mark
Labels = new string[] { "Sergio", "Lando", "Lewis" }, // mark
LabelsRotation = 15,
}
};
public Axis[] YAxes { get; set; } =
{
new Axis
{
Name = "Salome",
NamePadding = new LiveChartsCore.Drawing.Padding(0, 15),
LabelsPaint = new SolidColorPaint
{
Color = SKColors.Blue,
FontFamily = "Times New Roman",
SKFontStyle = new SKFontStyle(SKFontStyleWeight.ExtraBold, SKFontStyleWidth.Normal, SKFontStyleSlant.Italic)
},
// Use the Labeler property to give format to the axis values // mark
// Now the Y axis we will display it as currency
// LiveCharts provides some common formatters
// in this case we are using the currency formatter.
Labeler = Labelers.Currency // mark
// you could also build your own currency formatter
// for example:
// Labeler = (value) => value.ToString("C")
// But the one that LiveCharts provides creates shorter labels when
// the amount is in millions or trillions
}
};
}
Form code behind
using System.Windows.Forms;
using LiveChartsCore.SkiaSharpView.WinForms;
using ViewModelsSamples.Axes.LabelsFormat;

namespace WinFormsSample.Axes.LabelsFormat;

public partial class View : UserControl
{
    private readonly CartesianChart cartesianChart;

    public View()
    {
        InitializeComponent();
        Size = new System.Drawing.Size(50, 50);

        var viewModel = new ViewModel();

        cartesianChart = new CartesianChart
        {
            Series = viewModel.Series,
            XAxes = viewModel.XAxes,
            YAxes = viewModel.YAxes,

            // out of livecharts properties...
            Location = new System.Drawing.Point(0, 0),
            Size = new System.Drawing.Size(50, 50),
            Anchor = AnchorStyles.Left | AnchorStyles.Right | AnchorStyles.Top | AnchorStyles.Bottom
        };

        Controls.Add(cartesianChart);
    }
}