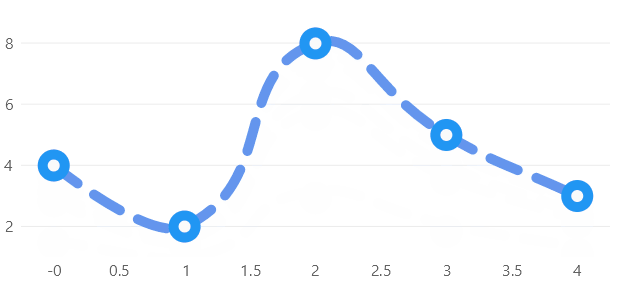
Dashed Lines
Hover over the image to see the chart animation

View Model
using CommunityToolkit.Mvvm.ComponentModel;
using LiveChartsCore;
using LiveChartsCore.SkiaSharpView;
using LiveChartsCore.SkiaSharpView.Painting;
using LiveChartsCore.SkiaSharpView.Painting.Effects;
using SkiaSharp;

namespace ViewModelsSamples.Design.StrokeDashArray;

public partial class ViewModel : ObservableObject
{
    public ViewModel()
    {
        // The LiveChartsCore.SkiaSharpView.Painting.EffectsPathEffect abstract class is a wrapper for
        // the SkiaSharp.SKPathEffect object, in this case we will use the DashEffect class
        // to create a dash line as the stroke of our line series

        // notice the stroke thickness affects the stroke dash array
        // if you want to learn more about stroke dash arrays please see:
        // https://docs.microsoft.com/en-us/xamarin/xamarin-forms/user-interface/graphics/skiasharp/curves/effects#dots-and-dashes

        var strokeThickness = 10;
        var strokeDashArray = new float[] { 3 * strokeThickness, 2 * strokeThickness };
        var effect = new DashEffect(strokeDashArray);

        Series = new ISeries[]
        {
            new LineSeries<int>
            {
                Values = new [] { 4, 2, 8, 5, 3 },
                LineSmoothness = 1,
                GeometrySize = 22,
                Stroke = new SolidColorPaint
                {
                    Color = SKColors.CornflowerBlue,
                    StrokeCap = SKStrokeCap.Round,
                    StrokeThickness = strokeThickness,
                    PathEffect = effect
                },
                Fill = null
            }
        };
    }

    public ISeries[] Series { get; set; }
}
Code Behind
using System.Windows.Forms;
using LiveChartsCore.SkiaSharpView.WinForms;
using ViewModelsSamples.Design.StrokeDashArray;

namespace WinFormsSample.Design.StrokeDashArray;

public partial class View : UserControl
{
    private readonly CartesianChart cartesianChart;

    public View()
    {
        InitializeComponent();
        Size = new System.Drawing.Size(50, 50);

        var viewModel = new ViewModel();

        cartesianChart = new CartesianChart
        {
            Series = viewModel.Series,

            // out of livecharts properties...
            Location = new System.Drawing.Point(0, 0),
            Size = new System.Drawing.Size(50, 50),
            Anchor = AnchorStyles.Left | AnchorStyles.Right | AnchorStyles.Top | AnchorStyles.Bottom
        };

        Controls.Add(cartesianChart);
    }
}