Time Span Scale
This web site builds the control from code behind but you could also grab it from the toolbox, this sample also uses a ViewModel to populate the properties of the control(s) in this sample.
View model
using System;
using LiveChartsCore;
using LiveChartsCore.Defaults;
using LiveChartsCore.Kernel.Sketches;
using LiveChartsCore.SkiaSharpView;
namespace ViewModelsSamples.Axes.TimeSpanScaled;
public class ViewModel
{
public ISeries[] Series { get; set; } = [
new ColumnSeries<TimeSpanPoint>
{
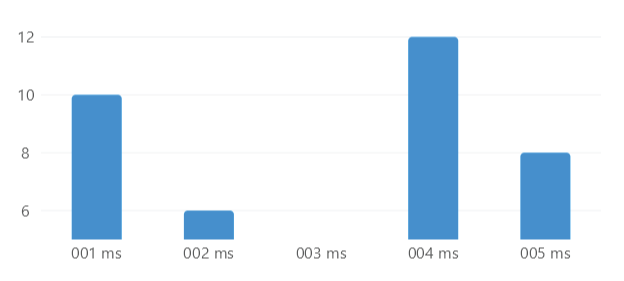
Values = [
new () { TimeSpan = TimeSpan.FromMilliseconds(1), Value = 10 },
new () { TimeSpan = TimeSpan.FromMilliseconds(2), Value = 6 },
new () { TimeSpan = TimeSpan.FromMilliseconds(3), Value = 3 },
new () { TimeSpan = TimeSpan.FromMilliseconds(4), Value = 12 },
new () { TimeSpan = TimeSpan.FromMilliseconds(5), Value = 8 }
],
}
];
// You can use the TimeSpanAxis class to define a time span based axis // mark
// The first parameter is the time between each point, in this case 1 day // mark
// you can also use 1 year, 1 month, 1 hour, 1 minute, 1 second, 1 millisecond, etc // mark
// The second parameter is a function that receives the value and returns the label // mark
public ICartesianAxis[] XAxes { get; set; } = [
new TimeSpanAxis(TimeSpan.FromMilliseconds(1), date => date.ToString("fff") + "ms")
];
}
Form code behind
using System.Windows.Forms;
using LiveChartsCore.SkiaSharpView.WinForms;
using ViewModelsSamples.Axes.TimeSpanScaled;

namespace WinFormsSample.Axes.TimeSpanScaled;

public partial class View : UserControl
{
    private readonly CartesianChart cartesianChart;

    public View()
    {
        InitializeComponent();
        Size = new System.Drawing.Size(50, 50);

        var viewModel = new ViewModel();

        cartesianChart = new CartesianChart
        {
            Series = viewModel.Series,
            XAxes = viewModel.XAxes,

            // out of livecharts properties...
            Location = new System.Drawing.Point(0, 0),
            Size = new System.Drawing.Size(50, 50),
            Anchor = AnchorStyles.Left | AnchorStyles.Right | AnchorStyles.Top | AnchorStyles.Bottom
        };

        Controls.Add(cartesianChart);
    }
}