Sections
This web site builds the control from code behind but you could also grab it from the toolbox.
Code behind
using System.Windows.Forms;
using LiveChartsCore.SkiaSharpView.WinForms;
using LiveChartsCore.SkiaSharpView;
using LiveChartsCore.SkiaSharpView.Painting;
using LiveChartsCore;
using LiveChartsCore.Defaults;
using SkiaSharp;
namespace WinFormsSample.General.Sections;
public partial class View : UserControl
{
public View()
{
InitializeComponent();
Size = new System.Drawing.Size(50, 50);
// Hard-coded values from WinUI sample
var values = new ObservablePoint[]
{
new(2.2, 5.4),
new(4.5, 2.5),
new(4.2, 7.4),
new(6.4, 9.9),
new(8.9, 3.9),
new(9.9, 5.2)
};
var series = new ISeries[]
{
new ScatterSeries<ObservablePoint>
{
Values = values
}
};
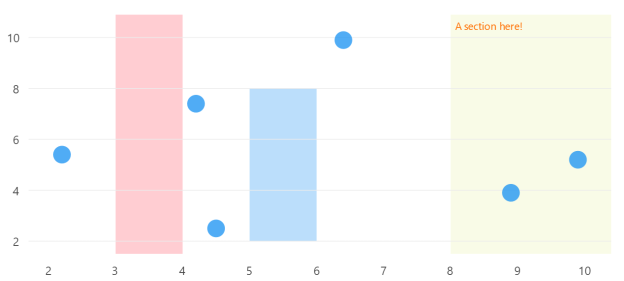
var sections = new RectangularSection[]
{
// Section from 3 to 4 in X axis
new() {
Xi = 3,
Xj = 4,
Fill = new SolidColorPaint(SKColor.Parse("#FFCDD2"))
},
// Section from 5 to 6 in X axis and 2 to 8 in Y axis
new() {
Xi = 5,
Xj = 6,
Yi = 2,
Yj = 8,
Fill = new SolidColorPaint(SKColor.Parse("#BBDEFB"))
},
// Section from 8 to end in X axis
new() {
Xi = 8,
Label = "A section here!",
LabelSize = 14,
LabelPaint = new SolidColorPaint(SKColor.Parse("#FF6F00")),
Fill = new SolidColorPaint(SKColor.Parse("#F9FBE7"))
}
};
var cartesianChart = new CartesianChart
{
Series = series,
Sections = sections,
Location = new System.Drawing.Point(0, 0),
Size = new System.Drawing.Size(50, 50),
Anchor = AnchorStyles.Left | AnchorStyles.Right | AnchorStyles.Top | AnchorStyles.Bottom
};
Controls.Add(cartesianChart);
}
}
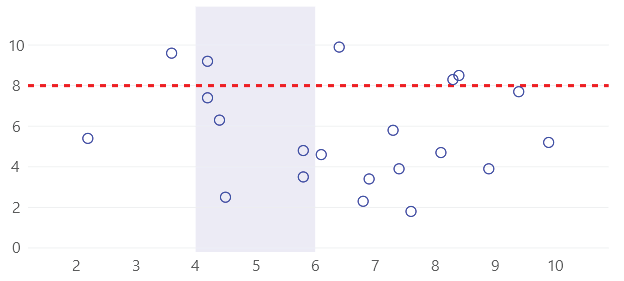
You can also create lines as sections, in the next example we set the same value for both
Yi and Yj and for the Xi and Xj we use the default value (null or double.NaN):
using System.Windows.Forms;
using LiveChartsCore.SkiaSharpView.WinForms;
using LiveChartsCore.SkiaSharpView;
using LiveChartsCore.SkiaSharpView.Painting;
using LiveChartsCore;
using LiveChartsCore.Defaults;
using SkiaSharp;
using ViewModelsSamples.General.Sections2;

namespace WinFormsSample.General.Sections2;

public partial class View : UserControl
{
    public View()
    {
        InitializeComponent();
        Size = new System.Drawing.Size(50, 50);

        var values = new ObservablePoint[]
        {
            new(2.2, 5.4), new(4.5, 2.5), new(4.2, 7.4),
            new(6.4, 9.9), new(4.2, 9.2), new(5.8, 3.5),
            new(7.3, 5.8), new(8.9, 3.9), new(6.1, 4.6),
            new(9.4, 7.7), new(8.4, 8.5), new(3.6, 9.6),
            new(4.4, 6.3), new(5.8, 4.8), new(6.9, 3.4),
            new(7.6, 1.8), new(8.3, 8.3), new(9.9, 5.2),
            new(8.1, 4.7), new(7.4, 3.9), new(6.8, 2.3)
        };

        var series = new ISeries[]
        {
            new ScatterSeries<ObservablePoint>
            {
                Values = values,
                GeometrySize = 10,
                Stroke = new SolidColorPaint(SKColor.Parse("#00f")),
                Fill = null
            }
        };

        var sections = new RectangularSection[]
        {
            new() {
                Yi = 8,
                Yj = 8,
                Stroke = new SolidColorPaint
                {
                    Color = SKColor.Parse("#F00"),
                    StrokeThickness = 3,
                    PathEffect = new LiveChartsCore.SkiaSharpView.Painting.Effects.DashEffect([6, 6])
                }
            },
            new() {
                Xi = 6,
                Xj = 8,
                Fill = new SolidColorPaint(SKColor.Parse("#300000FF"))
            }
        };

        var cartesianChart = new CartesianChart
        {
            Series = series,
            Sections = sections,
            Location = new System.Drawing.Point(0, 0),
            Size = new System.Drawing.Size(50, 50),
            Anchor = AnchorStyles.Left | AnchorStyles.Right | AnchorStyles.Top | AnchorStyles.Bottom
        };

        Controls.Add(cartesianChart);
    }
}