Installation and first chart
At this point you must enable the include prerelease checkbox to find LiveCharts NuGet packages
Open visual studio 2022, select "Create a new project", then select the WPF Application template.
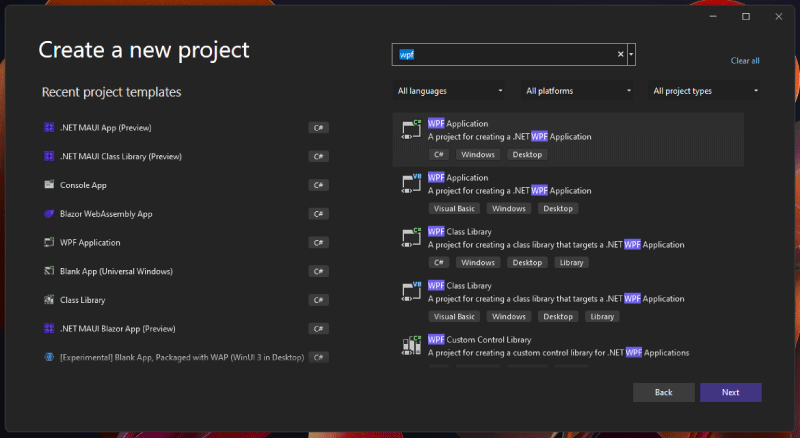
Name the project and the solution WpfSample, select .NET 8.0 as the target framework.
LiveCharts is also compatible with older versions of .NET even with 4.6.2.
Install from NuGet
Now install LiveCharts from NuGet. If you need more help to install a package from NuGet, please follow this guide.
LiveChartsCore.SkiaSharpView.WPF
Create a View Model
After the package is installed add a new class to your project as follows:
using LiveChartsCore;
using LiveChartsCore.SkiaSharpView;
using LiveChartsCore.SkiaSharpView.Drawing.Geometries;

namespace WpfSample;

public class ViewModel
{
    public ISeries[] Series { get; set; } = [
        new ColumnSeries<int>(3, 4, 2),
        new ColumnSeries<int>(4, 2, 6),
        new ColumnSeries<double, DiamondGeometry>(4, 3, 4)
    ];
}
Add the chart control to the UI
Finally go to the MainWindow.xaml file and add the LiveCharts namespace, don't forget to add also the namespace of your ViewModel class,
then add a CartesianChart control and bind the Series property:
<!-- mark -skip 3 -take 2 -->
<Window x:Class="MyApp"
    xmlns="http://schemas.microsoft.com/winfx/2006/xaml/presentation"
    xmlns:x="http://schemas.microsoft.com/winfx/2006/xaml"
    xmlns:local="clr-namespace:WPFSample"
    xmlns:lvc="clr-namespace:LiveChartsCore.SkiaSharpView.WPF;assembly=LiveChartsCore.SkiaSharpView.WPF">

    <Window.DataContext>
        <local:ViewModel /><!-- mark -->
    </Window.DataContext>

    <lvc:CartesianChart<!-- mark -->
        Series="{Binding Series}"><!-- mark -->
    </lvc:CartesianChart><!-- mark -->

</Window>
And that's it, start your application and you will see the chart in your main window.

If the chart is not showing, it is most likely that the layout where you placed the chart is hiding the control. LiveCharts controls do not have any size constraints, a quick fix is to explicitly set the size of the control (Width and Height), these related issues might help you #1483, #1581.
Configure themes, fonts or mappers (Optional)
Optionally you could configure LiveCharts to add a theme, register a global font, enable right to left tooltips
or a custom mapper for a type, when you need a non-Latin font you must register a typeface so SkiaShap can render
the text correctly, add the following code when your application starts:
Go to the Solution Explorer and browse for App.xaml.cs file, then override the OnStartup method as follows.
using System.Windows;
using LiveChartsCore; // mark

namespace WPFSample;

/// <summary>
/// Interaction logic for App.xaml
/// </summary>
public partial class App : Application
{
    protected override void OnStartup(StartupEventArgs e)
    {
        base.OnStartup(e);

        LiveCharts.Configure(config => // mark
            config // mark
                   // you can override the theme
                   // .AddDarkTheme() // mark

                // In case you need a non-Latin based font, you must register a typeface for SkiaSharp
                //.HasGlobalSKTypeface(SKFontManager.Default.MatchCharacter('汉')) // <- Chinese // mark
                //.HasGlobalSKTypeface(SKFontManager.Default.MatchCharacter('あ')) // <- Japanese // mark
                //.HasGlobalSKTypeface(SKFontManager.Default.MatchCharacter('헬')) // <- Korean // mark
                //.HasGlobalSKTypeface(SKFontManager.Default.MatchCharacter('Ж'))  // <- Russian // mark

                //.HasGlobalSKTypeface(SKFontManager.Default.MatchCharacter('أ'))  // <- Arabic // mark
                //.UseRightToLeftSettings() // Enables right to left tooltips // mark

                // finally register your own mappers
                // you can learn more about mappers at:
                // https://livecharts.dev/docs/wpf/2.0.0-rc5/Overview.Mappers

                // here we use the index as X, and the population as Y // mark
                .HasMap<City>((city, index) => new(index, city.Population)) // mark
            // .HasMap<Foo>( .... ) // mark
            // .HasMap<Bar>( .... ) // mark
            ); // mark
    }

    public record City(string Name, double Population);
}