Sections
This sample uses C# 13 preview features such as partial properties, it also uses features from the CommunityToolkit.Mvvm package, you can learn more about it here.
This web site wraps every sample using a UserControl instance, but LiveCharts controls can be used inside any container.
View model
using LiveChartsCore.Defaults;

namespace ViewModelsSamples.General.Sections;

public partial class ViewModel
{
    public ObservablePoint[] Values { get; set; } = [
        new ObservablePoint(2.2, 5.4),
        new ObservablePoint(4.5, 2.5),
        new ObservablePoint(4.2, 7.4),
        new ObservablePoint(6.4, 9.9),
        new ObservablePoint(8.9, 3.9),
        new ObservablePoint(9.9, 5.2)
    ];

    public double Xi1 { get; set; } = 3;
    public double Xj1 { get; set; } = 4;

    public double Xi2 { get; set; } = 5;
    public double Xj2 { get; set; } = 6;
    public double Yi2 { get; set; } = 2;
    public double Yj2 { get; set; } = 8;

    public double Xi3 { get; set; } = 8;
    public double Xj3 { get; set; } = double.NaN;
}
XAML
<UserControl
x:Class="AvaloniaSample.General.Sections.View"
xmlns="https://github.com/avaloniaui"
xmlns:x="http://schemas.microsoft.com/winfx/2006/xaml"
xmlns:lvc="using:LiveChartsCore.SkiaSharpView.Avalonia"
xmlns:vms="using:ViewModelsSamples.General.Sections"
x:DataType="vms:ViewModel">
<UserControl.DataContext>
<vms:ViewModel/>
</UserControl.DataContext>
<lvc:CartesianChart>
<lvc:CartesianChart.Series>
<lvc:XamlScatterSeries Values="{Binding Values}"/>
</lvc:CartesianChart.Series>
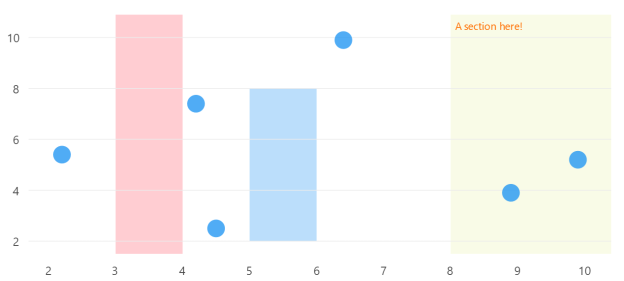
<lvc:CartesianChart.Sections>
<!-- creates a section from 3 to 4 in the X axis -->
<lvc:XamlRectangularSection
Xi="{Binding Xi1}"
Xj="{Binding Xj1}"
Fill="{lvc:SolidColorPaint Color='#FFCDD2'}"/>
<!--
creates a section from 5 to 6 in the X axis
and from 2 to 8 in the Y axis
-->
<lvc:XamlRectangularSection
Xi="{Binding Xi2}" Xj="{Binding Xj2}"
Yi="{Binding Yi2}" Yj="{Binding Yj2}"
Fill="{lvc:SolidColorPaint Color='#BBDEFB'}"/>
<!-- creates a section from 8 to the end in the X axis -->
<lvc:XamlRectangularSection
Xi="{Binding Xi3}"
Xj="{Binding Xj3}"
Label="A section here!"
LabelSize="14"
LabelPaint="{lvc:SolidColorPaint Color='#FF6F00'}"
Fill="{lvc:SolidColorPaint Color='#F9FBE7'}"/>
</lvc:CartesianChart.Sections>
</lvc:CartesianChart>
</UserControl>
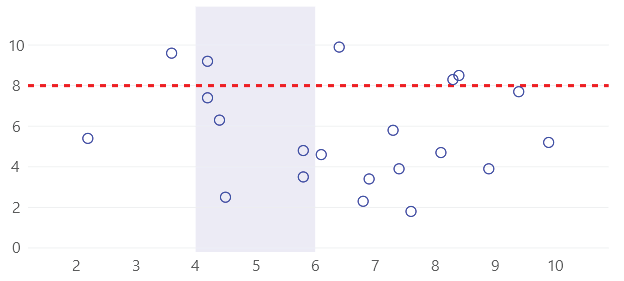
You can also create lines as sections, in the next example we set the same value for both
Yi and Yj and for the Xi and Xj we use the default value (null or double.NaN):
<UserControl
    x:Class="AvaloniaSample.General.Sections2.View"
    xmlns="https://github.com/avaloniaui"
    xmlns:x="http://schemas.microsoft.com/winfx/2006/xaml"
    xmlns:lvc="using:LiveChartsCore.SkiaSharpView.Avalonia"
    xmlns:vms="using:ViewModelsSamples.General.Sections2"
    x:DataType="vms:ViewModel">

    <UserControl.DataContext>
        <vms:ViewModel/>
    </UserControl.DataContext>

    <lvc:CartesianChart>

        <lvc:CartesianChart.Series>
            <lvc:XamlScatterSeries
                Values="{Binding Values}"
                GeometrySize="10"
                Stroke="{lvc:SolidColorPaint Color='#00f'}"
                Fill="{x:Null}"/>
        </lvc:CartesianChart.Series>

        <lvc:CartesianChart.Sections>
            <lvc:XamlRectangularSection
                Yi="8"
                Yj="8"
                Stroke="{lvc:SolidColorPaint
                    Color='#F00',
                    StrokeWidth=3,
                    PathEffect={lvc:Dashed Array='6, 6'}}"/>

            <lvc:XamlRectangularSection
                Xi="6"
                Xj="8"
                Fill="{lvc:SolidColorPaint Color='#300000FF'}"/>
        </lvc:CartesianChart.Sections>
    </lvc:CartesianChart>

</UserControl>