Axis Labels
Code behind
using Eto.Forms;
using LiveChartsCore;
using LiveChartsCore.SkiaSharpView;
using LiveChartsCore.SkiaSharpView.Eto;
namespace EtoFormsSample.Axes.LabelsFormat;
public class View : Panel
{
private readonly CartesianChart cartesianChart;
public View()
{
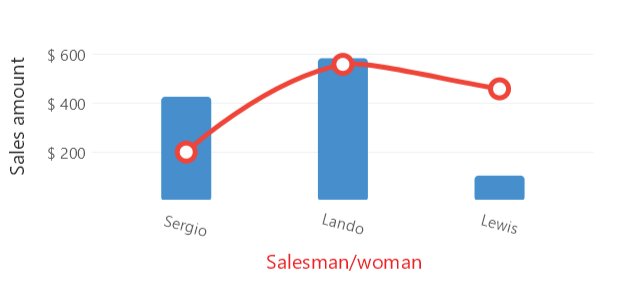
var values1 = new double[] { 426, 583, 104 };
var values2 = new double[] { 200, 558, 458 };
var labels = new string[] { "Sergio", "Lando", "Lewis" };
static string Labeler(double value) => value.ToString("C2");
var series = new ISeries[]
{
new ColumnSeries<double> { Values = values1 },
new ColumnSeries<double> { Values = values2, Fill = null }
};
var xAxis = new Axis
{
Name = "Salesman/woman",
Labels = labels
};
var yAxis = new Axis
{
Name = "Sales",
NamePadding = new LiveChartsCore.Drawing.Padding(0, 15),
Labeler = Labeler,
LabelsPaint = new LiveChartsCore.SkiaSharpView.Painting.SolidColorPaint(SkiaSharp.SKColors.Blue)
// FontFamily, FontWeight, FontWidth, FontSlant can be set if needed
};
cartesianChart = new CartesianChart
{
Series = series,
XAxes = [xAxis],
YAxes = [yAxis]
};
Content = cartesianChart;
}
}
Articles you might also find useful: