Sections
Code behind
using Eto.Forms;
using LiveChartsCore;
using LiveChartsCore.Defaults;
using LiveChartsCore.SkiaSharpView;
using LiveChartsCore.SkiaSharpView.Eto;
using LiveChartsCore.SkiaSharpView.Painting;
using SkiaSharp;
namespace EtoFormsSample.General.Sections;
public class View : Panel
{
public View()
{
var values = new ObservablePoint[]
{
new(2.2, 5.4),
new(4.5, 2.5),
new(4.2, 7.4),
new(6.4, 9.9),
new(8.9, 3.9),
new(9.9, 5.2)
};
var series = new ISeries[]
{
new ScatterSeries<ObservablePoint>
{
Values = values
}
};
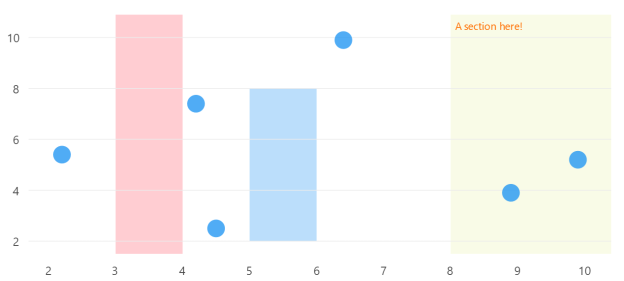
var sections = new RectangularSection[]
{
new() {
Xi = 3,
Xj = 4,
Fill = new SolidColorPaint(SKColor.Parse("#FFCDD2"))
},
new() {
Xi = 5,
Xj = 6,
Yi = 2,
Yj = 8,
Fill = new SolidColorPaint(SKColor.Parse("#BBDEFB"))
},
new() {
Xi = 8,
Label = "A section here!",
LabelSize = 14,
LabelPaint = new SolidColorPaint(SKColor.Parse("#FF6F00")),
Fill = new SolidColorPaint(SKColor.Parse("#F9FBE7"))
}
};
var cartesianChart = new CartesianChart
{
Series = series,
Sections = sections,
};
Content = cartesianChart;
}
}
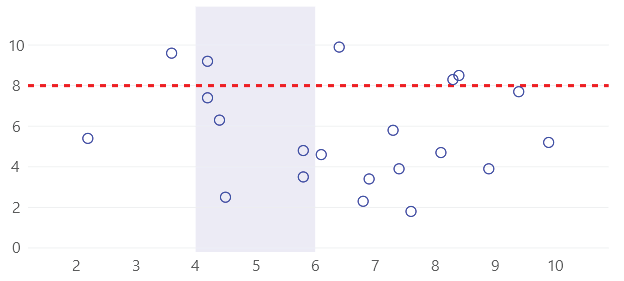
You can also create lines as sections, in the next example we set the same value for both
Yi and Yj and for the Xi and Xj we use the default value (null or double.NaN):
using Eto.Forms;
using LiveChartsCore;
using LiveChartsCore.Defaults;
using LiveChartsCore.SkiaSharpView;
using LiveChartsCore.SkiaSharpView.Eto;
using LiveChartsCore.SkiaSharpView.Painting;
using SkiaSharp;

namespace EtoFormsSample.General.Sections2;

public class View : Panel
{
    public View()
    {
        var values = new ObservablePoint[]
        {
            new(2.2, 5.4), new(4.5, 2.5), new(4.2, 7.4),
            new(6.4, 9.9), new(4.2, 9.2), new(5.8, 3.5),
            new(7.3, 5.8), new(8.9, 3.9), new(6.1, 4.6),
            new(9.4, 7.7), new(8.4, 8.5), new(3.6, 9.6),
            new(4.4, 6.3), new(5.8, 4.8), new(6.9, 3.4),
            new(7.6, 1.8), new(8.3, 8.3), new(9.9, 5.2),
            new(8.1, 4.7), new(7.4, 3.9), new(6.8, 2.3)
        };

        var series = new ISeries[]
        {
            new ScatterSeries<ObservablePoint>
            {
                Values = values,
                GeometrySize = 10,
                Stroke = new SolidColorPaint(SKColor.Parse("#00f")),
                Fill = null
            }
        };

        var sections = new RectangularSection[]
        {
            new() {
                Yi = 8,
                Yj = 8,
                Stroke = new SolidColorPaint
                {
                    Color = SKColor.Parse("#F00"),
                    StrokeThickness = 3,
                    PathEffect = new LiveChartsCore.SkiaSharpView.Painting.Effects.DashEffect(new float[] {6, 6})
                }
            },
            new() {
                Xi = 6,
                Xj = 8,
                Fill = new SolidColorPaint(SKColor.Parse("#300000FF"))
            }
        };

        var cartesianChart = new CartesianChart
        {
            Series = series,
            Sections = sections,
        };

        Content = cartesianChart;
    }
}