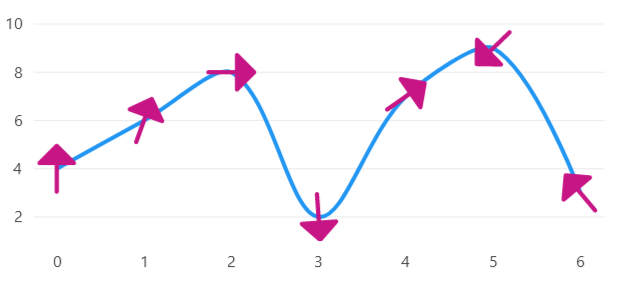
Wind Direction
This sample uses C# 13 preview features such as partial properties, it also uses features from the CommunityToolkit.Mvvm package, you can learn more about it here.
This web site wraps every sample using a UserControl instance, but LiveCharts controls can be used inside any container.
View model
using CommunityToolkit.Mvvm.ComponentModel;
using CommunityToolkit.Mvvm.Input;
using LiveChartsCore;
using LiveChartsCore.Kernel;
using LiveChartsCore.SkiaSharpView.Drawing.Geometries;
using SkiaSharp;

namespace ViewModelsSamples.Lines.CustomPoints;

public partial class ViewModel : ObservableObject
{
    public ViewModel()
    {
        LiveCharts.Configure(config =>
        {
            // The map is used to map the data points to the series
            // to learn more about mappers visit:
            // https://livecharts.dev/docs/{{ platform }}/{{ version }}/Overview.Mappers

            config.HasMap<DataPoint>(
                (dataPoint, index) => new(index, dataPoint.Value));
        });
    }

    public DataPoint[] Values { get; set; } =
    [
        new DataPoint { Value = 4, Rotation = 0 },
        new DataPoint { Value = 6, Rotation = 20 },
        new DataPoint { Value = 8, Rotation = 90 },
        new DataPoint { Value = 2, Rotation = 176 },
        new DataPoint { Value = 7, Rotation = 55 },
        new DataPoint { Value = 9, Rotation = 226 },
        new DataPoint { Value = 3, Rotation = 320 }
    ];

    // The pnt measured command/event is triggered when a point size
    // and position is calculated, for this example we use a command,
    // but you could also subscribe to the series PointMeasured event.

    [RelayCommand]
    public void OnPointMeasured(ChartPoint point)
    {
        var dataPoint = (DataPoint)point.Context.DataSource!;
        point.Context.Visual!.RotateTransform = dataPoint.Rotation;
    }

    public DataPoint[] Fetch()
    {
        return [
            new DataPoint { Value = 4, Rotation = 0 },
            new DataPoint { Value = 6, Rotation = 20 },
            new DataPoint { Value = 8, Rotation = 90 },
            new DataPoint { Value = 2, Rotation = 176 },
            new DataPoint { Value = 7, Rotation = 55 },
            new DataPoint { Value = 9, Rotation = 226 },
            new DataPoint { Value = 3, Rotation = 320 }
        ];
    }
}

public class DataPoint
{
    public int Value { get; set; }
    public float Rotation { get; set; }
}


public class ArrowGeometry : BaseSVGPathGeometry
{
    // svg path from:
    // https://www.svgrepo.com/svg/525637/arrow-up

    private static SKPath _path = SKPath.ParseSvgPathData(
        "M12.75 20C12.75 20.4142 12.4142 20.75 12 20.75C11.5858 20.75 11.25 20.4142 11.25 " +
        "20L11.25 10.75H6.00002C5.69668 10.75 5.4232 10.5673 5.30711 10.287C5.19103 10.0068 " +
        "5.25519 9.68417 5.46969 9.46967L11.4697 3.46967C11.6103 3.32902 11.8011 3.25 12 " +
        "3.25C12.1989 3.25 12.3897 3.32902 12.5304 3.46967L18.5304 9.46967C18.7449 9.68417 " +
        "18.809 10.0068 18.6929 10.287C18.5768 10.5673 18.3034 10.75 18 10.75H12.75L12.75 20Z");

    public ArrowGeometry()
        : base(_path)
    { }
}
MyGeometry.cs
using LiveChartsCore.Drawing; using LiveChartsCore.SkiaSharpView.Drawing;
namespace ViewModelsSamples.Lines.Custom;
public class MyGeometry : BoundedDrawnGeometry, IDrawnElement
    canvas.DrawRect(X, Y, Width, Height, paint);
    canvas.DrawLine(X, Y, X + Width, Y + Height, paint);
    canvas.DrawLine(X + Width, Y, X, Y + Height, paint);
}
}
XAML
<UserControl
    x:Class="WPFSample.Lines.CustomPoints.View"
    xmlns="http://schemas.microsoft.com/winfx/2006/xaml/presentation"
    xmlns:x="http://schemas.microsoft.com/winfx/2006/xaml"
    xmlns:lvc="clr-namespace:LiveChartsCore.SkiaSharpView.WPF;assembly=LiveChartsCore.SkiaSharpView.WPF"
    xmlns:vms="clr-namespace:ViewModelsSamples.Lines.CustomPoints;assembly=ViewModelsSamples"
    xmlns:local="clr-namespace:WPFSample.Lines.CustomPoints">

    <UserControl.DataContext>
        <vms:ViewModel/>
    </UserControl.DataContext>

    <lvc:CartesianChart>
        <lvc:CartesianChart.Series>
            <lvc:SeriesCollection>
                <local:CustomArrowLineSeries
                    GeometrySize="50"
                    GeometryStroke="{x:Null}"
                    GeometryFill="{lvc:SolidColorPaint Color='#C71585'}"
                    Fill="{x:Null}"
                    Values="{Binding Values}"
                    PointMeasuredCommand="{Binding PointMeasuredCommand}"/>
            </lvc:SeriesCollection>
        </lvc:CartesianChart.Series>
    </lvc:CartesianChart>

</UserControl>
CustomSeries.cs
using LiveChartsCore.SkiaSharpView;
using LiveChartsCore.SkiaSharpView.WPF;
using ViewModelsSamples.Lines.CustomPoints;

namespace WPFSample.Lines.CustomPoints;

// WPF xaml parser does not support generic types
// we instead create a non-generic class that inherits from the generic one.
public class CustomArrowLineSeries : XamlLineSeries<DataPoint, ArrowGeometry> { }