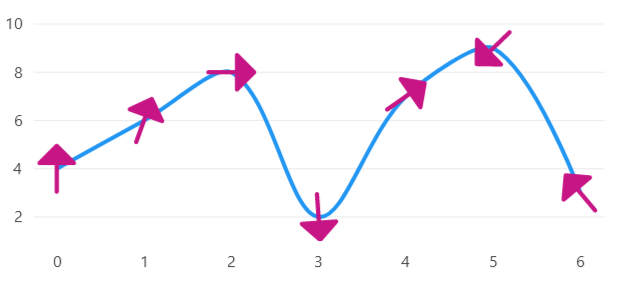
Wind Direction
MyGeometry.cs
using LiveChartsCore.Drawing; using LiveChartsCore.SkiaSharpView.Drawing;
namespace ViewModelsSamples.Lines.Custom;
public class MyGeometry : BoundedDrawnGeometry, IDrawnElement
    canvas.DrawRect(X, Y, Width, Height, paint);
    canvas.DrawLine(X, Y, X + Width, Y + Height, paint);
    canvas.DrawLine(X + Width, Y, X, Y + Height, paint);
}
}
Razor
@page "/Lines/CustomPoints"
@using LiveChartsCore.SkiaSharpView.Blazor
@using LiveChartsCore;
@using LiveChartsCore.SkiaSharpView;
@using LiveChartsCore.SkiaSharpView.Drawing.Geometries;
@using LiveChartsCore.SkiaSharpView.Painting;
@using SkiaSharp;

<CartesianChart
    Series="@series">
</CartesianChart>

@code {
    public class DataPoint
    {
        public int Value { get; set; }
        public float Rotation { get; set; }
    }

    public class ArrowGeometry : BaseSVGPathGeometry
    {
        private static SKPath _path = SKPath.ParseSvgPathData(
            "M12.75 20C12.75 20.4142 12.4142 20.75 12 20.75C11.5858 20.75 11.25 20.4142 11.25 " +
            "20L11.25 10.75H6.00002C5.69668 10.75 5.4232 10.5673 5.30711 10.287C5.19103 10.0068 " +
            "5.25519 9.68417 5.46969 9.46967L11.4697 3.46967C11.6103 3.32902 11.8011 3.25 12 " +
            "3.25C12.1989 3.25 12.3897 3.32902 12.5304 3.46967L18.5304 9.46967C18.7449 9.68417 " +
            "18.809 10.0068 18.6929 10.287C18.5768 10.5673 18.3034 10.75 18 10.75H12.75L12.75 20Z");
        public ArrowGeometry() : base(_path) { }
    }

    public class CustomArrowLineSeries : LineSeries<DataPoint, ArrowGeometry>
    {
        public CustomArrowLineSeries()
        {
            LiveCharts.Configure(config =>
                config.HasMap<DataPoint>((dataPoint, index) => new(index, dataPoint.Value)));
            GeometryFill = new SolidColorPaint(SKColor.Parse("#C71585"));
            GeometryStroke = null;
            Fill = null;
            GeometrySize = 50;
            PointMeasured += (point) =>
            {
                var dataPoint = (DataPoint)point.Context.DataSource!;
                point.Context.Visual!.TransformOrigin = new(0f, 0f);
                point.Context.Visual.RotateTransform = dataPoint.Rotation;
            };
        }
    }

    private ISeries[] series = new ISeries[]
    {
        new CustomArrowLineSeries
        {
            Values = new DataPoint[]
            {
                new DataPoint { Value = 4, Rotation = 0 },
                new DataPoint { Value = 6, Rotation = 20 },
                new DataPoint { Value = 8, Rotation = 90 },
                new DataPoint { Value = 2, Rotation = 176 },
                new DataPoint { Value = 7, Rotation = 55 },
                new DataPoint { Value = 9, Rotation = 226 },
                new DataPoint { Value = 3, Rotation = 320 }
            }
        }
    };
}