Bars Background
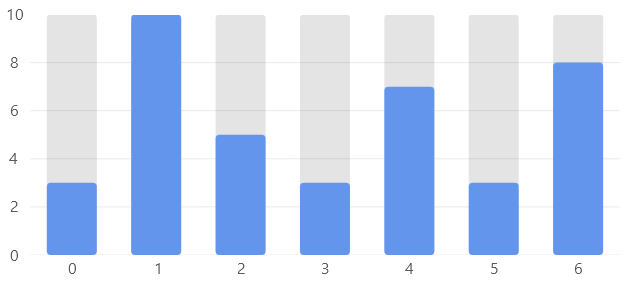
Hover over the image to see the chart animation
View Model
using SkiaSharp;
using LiveChartsCore;
using LiveChartsCore.SkiaSharpView;
using LiveChartsCore.SkiaSharpView.Painting;
using LiveChartsCore.Kernel.Sketches;

namespace ViewModelsSamples.Bars.WithBackground;

public class ViewModel
{
    public ISeries[] Series { get; set; } = [
        new ColumnSeries<double>
        {
            IsHoverable = false, // disables the series from the tooltips // mark
            Values = [10, 10, 10, 10, 10, 10, 10],
            Stroke = null,
            Fill = new SolidColorPaint(new SKColor(30, 30, 30, 30)),
            IgnoresBarPosition = true
        },
        new ColumnSeries<double>
        {
            Values = [3, 10, 5, 3, 7, 3, 8],
            Stroke = null,
            Fill = new SolidColorPaint(SKColors.CornflowerBlue),
            IgnoresBarPosition = true
        }
    ];

    public ICartesianAxis[] YAxes { get; set; } = [
        new Axis { MinLimit = 0, MaxLimit = 10 }
    ];
}
using Eto.Forms;
using LiveChartsCore.SkiaSharpView.Eto;
using ViewModelsSamples.Bars.WithBackground;

namespace EtoFormsSample.Bars.WithBackground;

public class View : Panel
{
    private readonly CartesianChart cartesianChart;

    public View()
    {
        var viewModel = new ViewModel();

        cartesianChart = new CartesianChart
        {
            Series = viewModel.Series,
            YAxes = viewModel.YAxes,
        };

        Content = cartesianChart;
    }
}