Bars Background
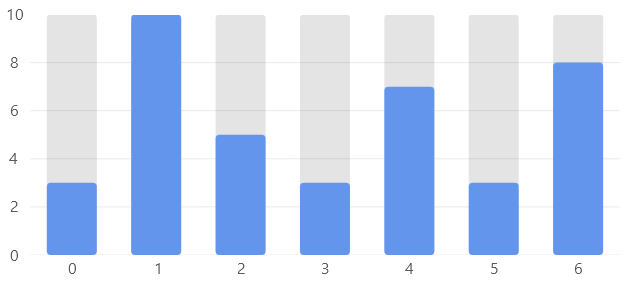
Hover over the image to see the chart animation
This sample uses C# 12 features, it also uses features from the CommunityToolkit.Mvvm package, you can learn more about it here.
View Model
using SkiaSharp;
using LiveChartsCore;
using LiveChartsCore.SkiaSharpView;
using LiveChartsCore.SkiaSharpView.Painting;
using LiveChartsCore.Kernel.Sketches;

namespace ViewModelsSamples.Bars.WithBackground;

public class ViewModel
{
    public ISeries[] Series { get; set; } = [
        new ColumnSeries<double>
        {
            IsHoverable = false, // disables the series from the tooltips // mark
            Values = [10, 10, 10, 10, 10, 10, 10],
            Stroke = null,
            Fill = new SolidColorPaint(new SKColor(30, 30, 30, 30)),
            IgnoresBarPosition = true
        },
        new ColumnSeries<double>
        {
            Values = [3, 10, 5, 3, 7, 3, 8],
            Stroke = null,
            Fill = new SolidColorPaint(SKColors.CornflowerBlue),
            IgnoresBarPosition = true
        }
    ];

    public ICartesianAxis[] YAxes { get; set; } = [
        new Axis { MinLimit = 0, MaxLimit = 10 }
    ];
}
XAML
<UserControl x:Class="WPFSample.Bars.WithBackground.View"
             xmlns="http://schemas.microsoft.com/winfx/2006/xaml/presentation"
             xmlns:x="http://schemas.microsoft.com/winfx/2006/xaml"
             xmlns:lvc="clr-namespace:LiveChartsCore.SkiaSharpView.WPF;assembly=LiveChartsCore.SkiaSharpView.WPF"
             xmlns:vms="clr-namespace:ViewModelsSamples.Bars.WithBackground;assembly=ViewModelsSamples">
    <UserControl.DataContext>
        <vms:ViewModel/>
    </UserControl.DataContext>
    <Grid>
        <Grid.RowDefinitions>
            <RowDefinition Height="*"/>
        </Grid.RowDefinitions>
        <lvc:CartesianChart Series="{Binding Series}" YAxes="{Binding YAxes}"></lvc:CartesianChart>
    </Grid>
</UserControl>