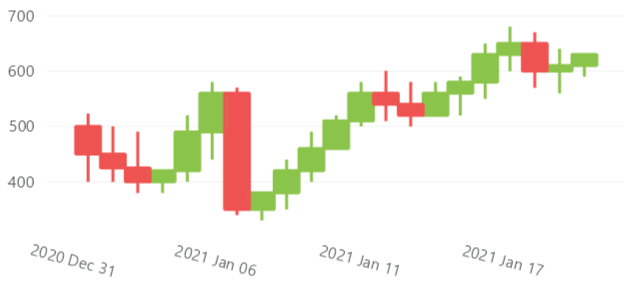
Basic Candle Sticks
Code behind
using System;
using System.Collections.ObjectModel;
using Eto.Forms;
using LiveChartsCore;
using LiveChartsCore.Defaults;
using LiveChartsCore.SkiaSharpView;
using LiveChartsCore.SkiaSharpView.Eto;

namespace EtoFormsSample.Financial.BasicCandlesticks;

public class View : Panel
{
    private readonly CartesianChart cartesianChart;

    public View()
    {
        var values = new ObservableCollection<FinancialPoint>
        {
            new() { Date = new DateTime(2021, 1, 1), High = 523, Open = 500, Close = 450, Low = 400 },
            new() { Date = new DateTime(2021, 1, 2), High = 500, Open = 450, Close = 425, Low = 400 },
            new() { Date = new DateTime(2021, 1, 3), High = 490, Open = 425, Close = 400, Low = 380 },
            new() { Date = new DateTime(2021, 1, 4), High = 420, Open = 400, Close = 420, Low = 380 },
            new() { Date = new DateTime(2021, 1, 5), High = 520, Open = 420, Close = 490, Low = 400 },
            new() { Date = new DateTime(2021, 1, 6), High = 580, Open = 490, Close = 560, Low = 440 }
        };
        static string dateFormatter(DateTime value) => value.ToString("yyyy MMM dd");

        var series = new ISeries[]
        {
            new CandlesticksSeries<FinancialPoint> { Values = values }
        };

        var xAxis = new DateTimeAxis(TimeSpan.FromDays(1), dateFormatter)
        {
            LabelsRotation = 0
        };

        cartesianChart = new CartesianChart
        {
            Series = series,
            XAxes = [xAxis],
        };

        Content = cartesianChart;
    }
}
Articles you might also find useful: