Customize Visuals
Code behind
using Eto.Forms;
using LiveChartsCore;
using LiveChartsCore.Kernel;
using LiveChartsCore.SkiaSharpView;
using LiveChartsCore.SkiaSharpView.Eto;
using LiveChartsCore.SkiaSharpView.Painting;
using SkiaSharp;
namespace EtoFormsSample.General.MapPoints;
public class View : Panel
{
private readonly CartesianChart cartesianChart;
public View()
{
var columnSeries = new ColumnSeries<int>
{
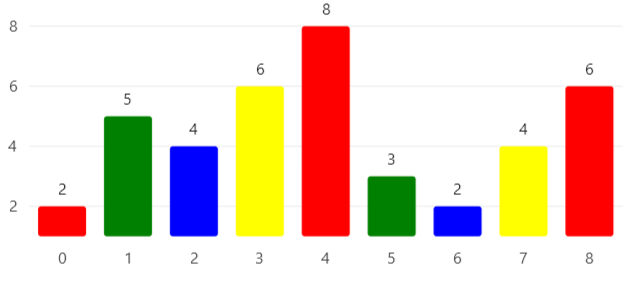
Values = [2, 5, 4, 6, 8, 3, 2, 4, 6]
};
columnSeries.PointMeasured += OnPointMeasured;
cartesianChart = new CartesianChart
{
Series = [columnSeries],
};
Content = cartesianChart;
}
private void OnPointMeasured(ChartPoint point)
{
if (point.Context.Visual is null) return;
point.Context.Visual.Fill = GetPaint(point.Index);
}
private SolidColorPaint GetPaint(int index)
{
var paints = new SolidColorPaint[]
{
new(SKColors.Red),
new(SKColors.Green),
new(SKColors.Blue),
new(SKColors.Yellow)
};
return paints[index % paints.Length];
}
}
Articles you might also find useful: