Customize Visuals
This sample uses C# 13 preview features such as partial properties, it also uses features from the CommunityToolkit.Mvvm package, you can learn more about it here.

View Model
using SkiaSharp;
using LiveChartsCore.SkiaSharpView.Painting;
using CommunityToolkit.Mvvm.Input;
using LiveChartsCore.Kernel;
namespace ViewModelsSamples.General.MapPoints;
public partial class ViewModel
{
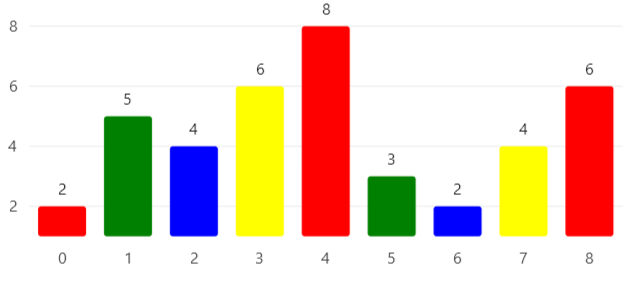
public int[] Values { get; set; } =
[2, 5, 4, 6, 8, 3, 2, 4, 6];
[RelayCommand]
private void OnPointMeasured(ChartPoint point)
{
// the PointMeasured command/event is called every time a point is measured,
// this happens when the chart loads, rezizes or when the data changes, this method
// is called for every point in the series.
if (point.Context.Visual is null) return;
// here we can customize the visual of the point, for example we can set
// a different color for each point.
point.Context.Visual.Fill = GetPaint(point.Index);
}
private SolidColorPaint GetPaint(int index)
{
var paints = new SolidColorPaint[]
{
new(SKColors.Red),
new(SKColors.Green),
new(SKColors.Blue),
new(SKColors.Yellow)
};
return paints[index % paints.Length];
}
}
XAML
<?xml version="1.0" encoding="utf-8" ?>
<ContentPage
    x:Class="MauiSample.General.MapPoints.View"
    xmlns="http://schemas.microsoft.com/dotnet/2021/maui"
    xmlns:x="http://schemas.microsoft.com/winfx/2009/xaml"
    xmlns:lvc="clr-namespace:LiveChartsCore.SkiaSharpView.Maui;assembly=LiveChartsCore.SkiaSharpView.Maui"
    xmlns:vms="clr-namespace:ViewModelsSamples.General.MapPoints;assembly=ViewModelsSamples"
    x:DataType="vms:ViewModel">

    <ContentPage.BindingContext>
        <vms:ViewModel/>
    </ContentPage.BindingContext>

    <lvc:CartesianChart>
        <lvc:CartesianChart.Series>
            <lvc:SeriesCollection>
                <lvc:XamlColumnSeries
                    ShowDataLabels="True"
                    DataLabelsPosition="Top"
                    Values="{Binding Values}"
                    PointMeasuredCommand="{Binding PointMeasuredCommand}"/>
            </lvc:SeriesCollection>
        </lvc:CartesianChart.Series>
    </lvc:CartesianChart>

</ContentPage>