Date Time Scale
This sample uses C# 13 preview features such as partial properties, it also uses features from the CommunityToolkit.Mvvm package, you can learn more about it here.
This web site wraps every sample using a ContentPage instance, but LiveCharts controls can be used inside any container.
View model
using System;
using LiveChartsCore.Defaults;
namespace ViewModelsSamples.Axes.DateTimeScaled;
public class ViewModel
{
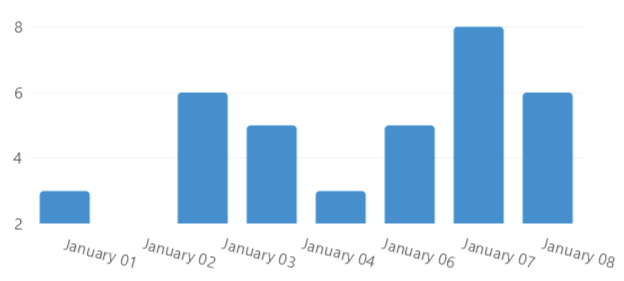
public DateTimePoint[] Values { get; set; } = [
new() { DateTime = new(2021, 1, 1), Value = 3 },
new() { DateTime = new(2021, 1, 2), Value = 6 },
new() { DateTime = new(2021, 1, 3), Value = 5 },
new() { DateTime = new(2021, 1, 4), Value = 3 },
new() { DateTime = new(2021, 1, 5), Value = 5 },
new() { DateTime = new(2021, 1, 6), Value = 8 },
new() { DateTime = new(2021, 1, 7), Value = 6 }
];
public Func<DateTime, string> Formatter { get; set; } =
date => date.ToString("MMMM dd");
}
XAML
<?xml version="1.0" encoding="utf-8" ?>
<ContentPage
    x:Class="MauiSample.Axes.DateTimeScaled.View"
    xmlns="http://schemas.microsoft.com/dotnet/2021/maui"
    xmlns:x="http://schemas.microsoft.com/winfx/2009/xaml"
    xmlns:lvc="clr-namespace:LiveChartsCore.SkiaSharpView.Maui;assembly=LiveChartsCore.SkiaSharpView.Maui"
    xmlns:vms="clr-namespace:ViewModelsSamples.Axes.DateTimeScaled;assembly=ViewModelsSamples"
    x:DataType="vms:ViewModel">

    <ContentPage.BindingContext>
        <vms:ViewModel/>
    </ContentPage.BindingContext>

    <lvc:CartesianChart>

        <lvc:CartesianChart.Series>
            <lvc:SeriesCollection>
                <lvc:XamlColumnSeries Values="{Binding Values}"/>
            </lvc:SeriesCollection>
        </lvc:CartesianChart.Series>

        <!--
            The Interval property is used to set the interval between each label,
            in this case, the interval is set to 1 day.

            In the DateFormatter property, we define the format of the labels.
        -->

        <lvc:CartesianChart.XAxes>
            <lvc:AxesCollection>
                <lvc:XamlDateTimeAxis
                    Interval="1.00:00:00"
                    DateFormatter="{Binding Formatter}"/>
            </lvc:AxesCollection>
        </lvc:CartesianChart.XAxes>

    </lvc:CartesianChart>
</ContentPage>