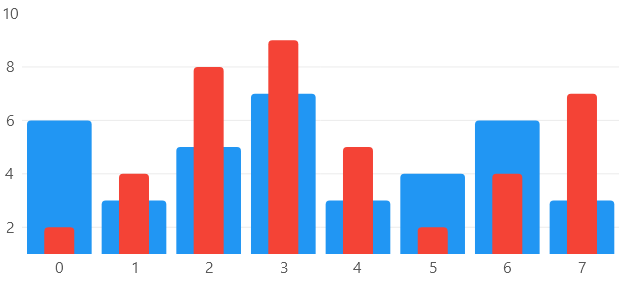
Layered Bars

Hover over the image to see the chart animation
This sample uses C# 12 features, it also uses features from the CommunityToolkit.Mvvm package, you can learn more about it here.
View Model
using LiveChartsCore;
using LiveChartsCore.SkiaSharpView;

namespace ViewModelsSamples.Bars.Layered;

public class ViewModel
{
    public ISeries[] Series { get; set; } = [
        new ColumnSeries<int>
        {
            Values = [6, 3, 5, 7, 3, 4, 6, 3],
            Stroke = null,
            MaxBarWidth = double.MaxValue,
            IgnoresBarPosition = true
        },
        new ColumnSeries<int>
        {
            Values = [2, 4, 8, 9, 5, 2, 4, 7],
            Stroke = null,
            MaxBarWidth = 30,
            IgnoresBarPosition = true
        }
    ];
}
XAML
<UserControl
    x:Class="UnoWinUISample.Bars.Layered.View"
    xmlns="http://schemas.microsoft.com/winfx/2006/xaml/presentation"
    xmlns:x="http://schemas.microsoft.com/winfx/2006/xaml"
    xmlns:d="http://schemas.microsoft.com/expression/blend/2008"
    xmlns:mc="http://schemas.openxmlformats.org/markup-compatibility/2006"
    xmlns:lvc="using:LiveChartsCore.SkiaSharpView.WinUI"
    xmlns:vms="using:ViewModelsSamples.Bars.Layered"
    mc:Ignorable="d">

    <UserControl.DataContext>
        <vms:ViewModel/>
    </UserControl.DataContext>
    <Grid>
        <lvc:CartesianChart Name="chart" Series="{Binding Series}"></lvc:CartesianChart>
    </Grid>

</UserControl>