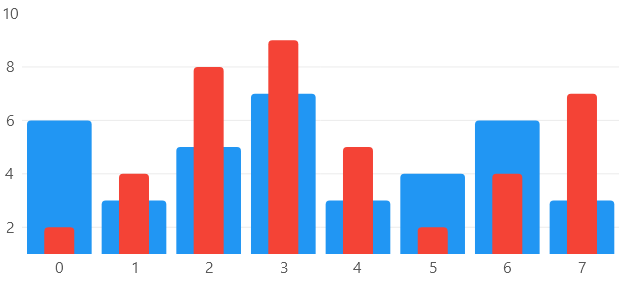
Layered Bars

Hover over the image to see the chart animation
View Model
using LiveChartsCore;
using LiveChartsCore.SkiaSharpView;

namespace ViewModelsSamples.Bars.Layered;

public class ViewModel
{
    public ISeries[] Series { get; set; } = [
        new ColumnSeries<int>
        {
            Values = [6, 3, 5, 7, 3, 4, 6, 3],
            Stroke = null,
            MaxBarWidth = double.MaxValue,
            IgnoresBarPosition = true
        },
        new ColumnSeries<int>
        {
            Values = [2, 4, 8, 9, 5, 2, 4, 7],
            Stroke = null,
            MaxBarWidth = 30,
            IgnoresBarPosition = true
        }
    ];
}
Code Behind
using System.Windows.Forms;
using LiveChartsCore.SkiaSharpView.WinForms;
using ViewModelsSamples.Bars.Layered;

namespace WinFormsSample.Bars.Layered;

public partial class View : UserControl
{
    private readonly CartesianChart cartesianChart;

    public View()
    {
        InitializeComponent();
        Size = new System.Drawing.Size(50, 50);

        var viewModel = new ViewModel();

        cartesianChart = new CartesianChart
        {
            Series = viewModel.Series,

            // out of livecharts properties...
            Location = new System.Drawing.Point(0, 0),
            Size = new System.Drawing.Size(50, 50),
            Anchor = AnchorStyles.Left | AnchorStyles.Right | AnchorStyles.Top | AnchorStyles.Bottom
        };

        Controls.Add(cartesianChart);
    }
}