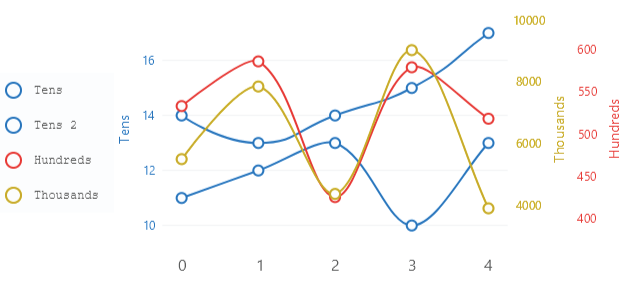
Multiple Axes
This web site builds the control from code behind but you could also grab it from the toolbox, this sample also uses a ViewModel to populate the properties of the control(s) in this sample.
Code behind
using System.Windows.Forms;
using LiveChartsCore;
using LiveChartsCore.SkiaSharpView;
using LiveChartsCore.SkiaSharpView.Painting;
using LiveChartsCore.SkiaSharpView.WinForms;
using SkiaSharp;

#pragma warning disable IDE1006 // Naming Styles

namespace WinFormsSample.Axes.Multiple;

public partial class View : UserControl
{
    private readonly CartesianChart cartesianChart;

    public View()
    {
        InitializeComponent();
        Size = new System.Drawing.Size(50, 50);

        var values1 = new double[] { 14, 13, 14, 15, 17 };
        var values2 = new double[] { 11, 12, 13, 10, 13 };
        var values3 = new double[] { 533, 586, 425, 579, 518 };
        var values4 = new double[] { 5493, 7843, 4368, 9018, 3902 };

        var blue = new SKColor(25, 118, 210);
        var red = new SKColor(229, 57, 53);
        var yellow = new SKColor(198, 167, 0);
        var legendBg = new SKColor(238, 238, 238);
        var legendText = new SKColor(50, 50, 50);

        var series = new ISeries[]
        {
            new LineSeries<double>
            {
                Name = "Tens",
                Values = values1,
                Stroke = new SolidColorPaint(blue, 2),
                GeometryStroke = new SolidColorPaint(blue, 2),
                Fill = null,
                ScalesYAt = 0 // This series will be scaled on the first Y axis
            },
            new LineSeries<double>
            {
                Name = "Tens 2",
                Values = values2,
                Stroke = new SolidColorPaint(blue, 2),
                GeometryStroke = new SolidColorPaint(blue, 2),
                Fill = null,
                ScalesYAt = 0 // This series will also be scaled on the first Y axis
            },
            new LineSeries<double>
            {
                Name = "Hundreds",
                Values = values3,
                Stroke = new SolidColorPaint(red, 2),
                GeometryStroke = new SolidColorPaint(red, 2),
                Fill = null,
                ScalesYAt = 1 // This series will be scaled on the second Y axis
            },
            new LineSeries<double>
            {
                Name = "Thousands",
                Values = values4,
                Stroke = new SolidColorPaint(yellow, 2),
                GeometryStroke = new SolidColorPaint(yellow, 2),
                Fill = null,
                ScalesYAt = 2 // This series will be scaled on the third Y axis
            }
        };

        var yAxes = new Axis[]
        {
            new() {
                Name = "Tens",
                Padding = new LiveChartsCore.Drawing.Padding(0, 0, 20, 0),
                NamePaint = new SolidColorPaint(blue),
                LabelsPaint = new SolidColorPaint(blue),
                TicksPaint = new SolidColorPaint(blue),
                SubticksPaint = new SolidColorPaint(blue)
            },
            new() {
                Name = "Hundreds",
                Padding = new LiveChartsCore.Drawing.Padding(20, 0, 0, 0),
                Position = LiveChartsCore.Measure.AxisPosition.End,
                ShowSeparatorLines = false,
                NamePaint = new SolidColorPaint(red),
                LabelsPaint = new SolidColorPaint(red),
                TicksPaint = new SolidColorPaint(red),
                SubticksPaint = new SolidColorPaint(red)
            },
            new() {
                Name = "Thousands",
                Padding = new LiveChartsCore.Drawing.Padding(20, 0, 0, 0),
                Position = LiveChartsCore.Measure.AxisPosition.End,
                ShowSeparatorLines = false,
                NamePaint = new SolidColorPaint(yellow),
                LabelsPaint = new SolidColorPaint(yellow),
                TicksPaint = new SolidColorPaint(yellow),
                SubticksPaint = new SolidColorPaint(yellow)
            }
        };

        cartesianChart = new CartesianChart
        {
            Series = series,
            YAxes = yAxes,
            LegendPosition = LiveChartsCore.Measure.LegendPosition.Left,
            LegendTextPaint = new SolidColorPaint(legendText),
            LegendBackgroundPaint = new SolidColorPaint(legendBg),
            LegendTextSize = 16,
            Location = new System.Drawing.Point(0, 0),
            Size = new System.Drawing.Size(50, 50),
            Anchor = AnchorStyles.Left | AnchorStyles.Right | AnchorStyles.Top | AnchorStyles.Bottom
        };

        Controls.Add(cartesianChart);
    }
}