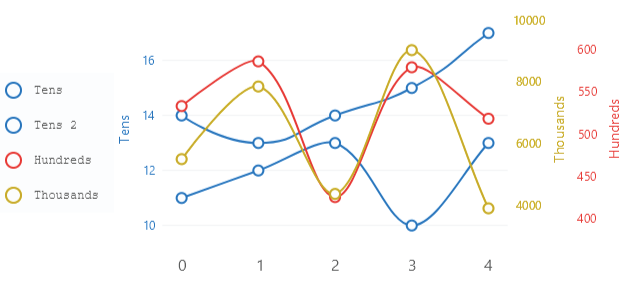
Multiple Axes
This sample uses C# 13 preview features such as partial properties, it also uses features from the CommunityToolkit.Mvvm package, you can learn more about it here.
This web site wraps every sample using a ContentPage instance, but LiveCharts controls can be used inside any container.
View model
namespace ViewModelsSamples.Axes.Multiple;

public class ViewModel
{
    public double[] Values1 { get; set; } = [14, 13, 14, 15, 17];
    public double[] Values2 { get; set; } = [11, 12, 13, 10, 13];
    public double[] Values3 { get; set; } = [533, 586, 425, 579, 518];
    public double[] Values4 { get; set; } = [5493, 7843, 4368, 9018, 3902];
}
XAML
<?xml version="1.0" encoding="utf-8" ?>
<ContentPage
    x:Class="MauiSample.Axes.Multiple.View"
    xmlns="http://schemas.microsoft.com/dotnet/2021/maui"
    xmlns:x="http://schemas.microsoft.com/winfx/2009/xaml"
    xmlns:lvc="clr-namespace:LiveChartsCore.SkiaSharpView.Maui;assembly=LiveChartsCore.SkiaSharpView.Maui"
    xmlns:vms="clr-namespace:ViewModelsSamples.Axes.Multiple;assembly=ViewModelsSamples"
    x:DataType="vms:ViewModel">

    <ContentPage.BindingContext>
        <vms:ViewModel/>
    </ContentPage.BindingContext>

    <ContentPage.Resources>
        <x:String x:Key="blue">#1976D2</x:String>
        <x:String x:Key="red">#E53935</x:String>
        <x:String x:Key="yellow">#C6A700</x:String>
    </ContentPage.Resources>

    <lvc:CartesianChart
        LegendBackgroundPaint="{lvc:SolidColorPaint Color='#eee', FontFamily='Courier New'}"
        LegendTextPaint="#323232"
        LegendTextSize="16"
        LegendPosition="Left">

        <lvc:CartesianChart.Resources>
            <Style TargetType="lvc:XamlLineSeries">
                <Setter Property="GeometrySize" Value="10"/>
                <Setter Property="Fill" Value="{x:Null}"/>
                <Setter Property="LineSmoothness" Value="1"/>
            </Style>
            <Style TargetType="lvc:XamlAxis">
                <Setter Property="NameTextSize" Value="14"/>
                <Setter Property="NamePadding" Value="0,20"/>
                <Setter Property="TextSize" Value="12"/>
                <Setter Property="DrawTicksPath" Value="True"/>
            </Style>
        </lvc:CartesianChart.Resources>

        <!--
        The ScaleYAt property is used to assign a series to a specific Y axis.
        -->

        <lvc:CartesianChart.Series>
            <lvc:SeriesCollection>
                <lvc:XamlLineSeries
                    SeriesName="Tens"
                    Values="{Binding Values1}"
                    Stroke="{lvc:SolidColorPaint Color={StaticResource blue}, StrokeWidth=2}"
                    GeometryStroke="{lvc:SolidColorPaint Color={StaticResource blue}, StrokeWidth=2}"
                    ScalesYAt="0"/>
                <lvc:XamlLineSeries
                    SeriesName="Tens 2"
                    Values="{Binding Values2}"
                    Stroke="{lvc:SolidColorPaint Color={StaticResource blue}, StrokeWidth=2}"
                    GeometryStroke="{lvc:SolidColorPaint Color={StaticResource blue}, StrokeWidth=2}"
                    ScalesYAt="0"/>
                <lvc:XamlLineSeries
                    SeriesName="Hundreds"
                    Values="{Binding Values3}"
                    Stroke="{lvc:SolidColorPaint Color={StaticResource red}, StrokeWidth=2}"
                    GeometryStroke="{lvc:SolidColorPaint Color={StaticResource red}, StrokeWidth=2}"
                    ScalesYAt="1"/>
                <lvc:XamlLineSeries
                    SeriesName="Thousands"
                    Values="{Binding Values4}"
                    Stroke="{lvc:SolidColorPaint Color={StaticResource yellow}, StrokeWidth=2}"
                    GeometryStroke="{lvc:SolidColorPaint Color={StaticResource yellow}, StrokeWidth=2}"
                    ScalesYAt="2"/>
            </lvc:SeriesCollection>
        </lvc:CartesianChart.Series>

        <lvc:CartesianChart.YAxes>
            <lvc:AxesCollection>
                <lvc:XamlAxis
                    AxisName="Tens"
                    Padding="0, 0, 20, 0"
                    NamePaint="{lvc:SolidColorPaint Color={StaticResource blue}}"
                    LabelsPaint="{lvc:SolidColorPaint Color={StaticResource blue}}"
                    TicksPaint="{lvc:SolidColorPaint Color={StaticResource blue}}"
                    SubticksPaint="{lvc:SolidColorPaint Color={StaticResource blue}}"/>
                <lvc:XamlAxis
                    AxisName="Hundreds"
                    Padding="20, 0, 0, 0"
                    Position="End"
                    ShowSeparatorLines="False"
                    NamePaint="{lvc:SolidColorPaint Color={StaticResource red}}"
                    LabelsPaint="{lvc:SolidColorPaint Color={StaticResource red}}"
                    TicksPaint="{lvc:SolidColorPaint Color={StaticResource red}}"
                    SubticksPaint="{lvc:SolidColorPaint Color={StaticResource red}}"/>
                <lvc:XamlAxis
                    AxisName="Thousands"
                    Padding="20, 0, 0, 0"
                    Position="End"
                    ShowSeparatorLines="False"
                    NamePaint="{lvc:SolidColorPaint Color={StaticResource yellow}}"
                    LabelsPaint="{lvc:SolidColorPaint Color={StaticResource yellow}}"
                    TicksPaint="{lvc:SolidColorPaint Color={StaticResource yellow}}"
                    SubticksPaint="{lvc:SolidColorPaint Color={StaticResource yellow}}"/>
            </lvc:AxesCollection>
        </lvc:CartesianChart.YAxes>

    </lvc:CartesianChart>
</ContentPage>