Charts As Image/Svg
Notice this web site wraps every sample using the UserControl class, but LiveCharts controls can be used inside any container,
this sample also follows a Model-View-* pattern.
View model
namespace ViewModelsSamples.General.ChartToImage;
public partial class ViewModel
{
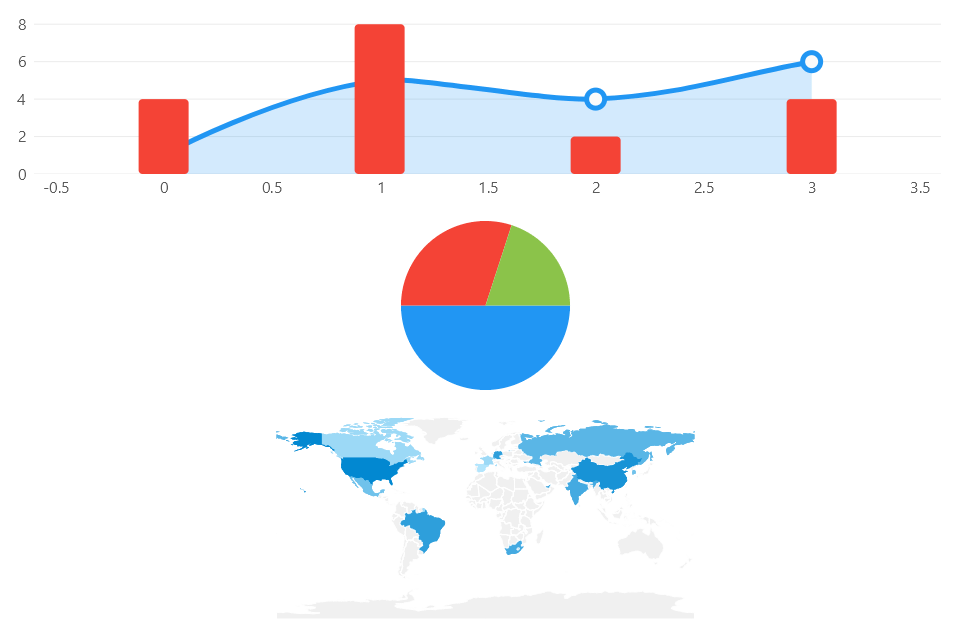
public double[] Values1 { get; set; } = [1, 5, 4, 6];
public double[] Values2 { get; set; } = [4, 8, 2, 4];
public double[] PieValues1 { get; set; } = [10];
public double[] PieValues2 { get; set; } = [6];
public double[] PieValues3 { get; set; } = [4];
}
XAML
Having the previous data (ViewModel), we add 3 charts to the UI, a CartesianChart, a PieChart and a GeoMap.
<UserControl
    x:Class="WPFSample.General.ChartToImage.View"
    xmlns="http://schemas.microsoft.com/winfx/2006/xaml/presentation"
    xmlns:x="http://schemas.microsoft.com/winfx/2006/xaml"
    xmlns:lvc="clr-namespace:LiveChartsCore.SkiaSharpView.WPF;assembly=LiveChartsCore.SkiaSharpView.WPF"
    xmlns:vms="clr-namespace:ViewModelsSamples.General.ChartToImage;assembly=ViewModelsSamples">

    <UserControl.DataContext>
        <vms:ViewModel/>
    </UserControl.DataContext>

    <Grid>
        <Grid.RowDefinitions>
            <RowDefinition Height="*"/>
            <RowDefinition Height="*"/>
        </Grid.RowDefinitions>

        <lvc:CartesianChart
            Grid.Row="0"
            x:Name="cartesianChart">
            <lvc:CartesianChart.Series>
                <lvc:SeriesCollection>
                    <lvc:XamlLineSeries Values="{Binding Values1}"/>
                    <lvc:XamlColumnSeries Values="{Binding Values2}"/>
                </lvc:SeriesCollection>
            </lvc:CartesianChart.Series>
        </lvc:CartesianChart>

        <lvc:PieChart
            Grid.Row="1"
            x:Name="pieChart">
            <lvc:PieChart.Series>
                <lvc:SeriesCollection>
                    <lvc:XamlPieSeries Values="{Binding PieValues1}"/>
                    <lvc:XamlPieSeries Values="{Binding PieValues2}"/>
                    <lvc:XamlPieSeries Values="{Binding PieValues3}"/>
                </lvc:SeriesCollection>
            </lvc:PieChart.Series>
        </lvc:PieChart>
    </Grid>

</UserControl>
You will get the following plot in the UI.
You can take any control in the UI and build an image from it, in the next example, for simplicity, we build an image of our charts once the view is loaded.
using System.Windows.Controls;
using LiveChartsCore.SkiaSharpView.SKCharts;
using LiveChartsCore.SkiaSharpView.WPF;

namespace WPFSample.General.ChartToImage;

/// <summary>
/// Interaction logic for View.xaml
/// </summary>
public partial class View : UserControl
{
    public View()
    {
        InitializeComponent();

        // in this case, when the view is loaded // mark
        // we render our chart controls as images // mark
        Loaded += View_Loaded;
    }

    private void View_Loaded(object sender, System.Windows.RoutedEventArgs e)
    {
        CreateImageFromCartesianControl();
        CreateImageFromPieControl();
    }

    private void CreateImageFromCartesianControl()
    {
        // you can take any chart in the UI, and build an image from it // mark
        var chartControl = (CartesianChart)FindName("cartesianChart");
        var skChart = new SKCartesianChart(chartControl);
        skChart.SaveImage("CartesianImageFromControl.png");
    }

    private void CreateImageFromPieControl()
    {
        var chartControl = (PieChart)FindName("pieChart");
        var skChart = new SKPieChart(chartControl);
        skChart.SaveImage("PieImageFromControl.png");
    }
}
Build an image in the server side or console app
LiveCharts can render images without the need of any UI framework, you can build images in the server side or in a console application as far as you install the SkiaSharp view package, it is available from NuGet:
Notice any view of LiveCharts (WPF, WinForms, Maui, etc..) has a dependency on LiveChartsCore.SkiaSharpView package, thus you do not need to install this package again if you are already using LiveCharts to render any control in the UI.
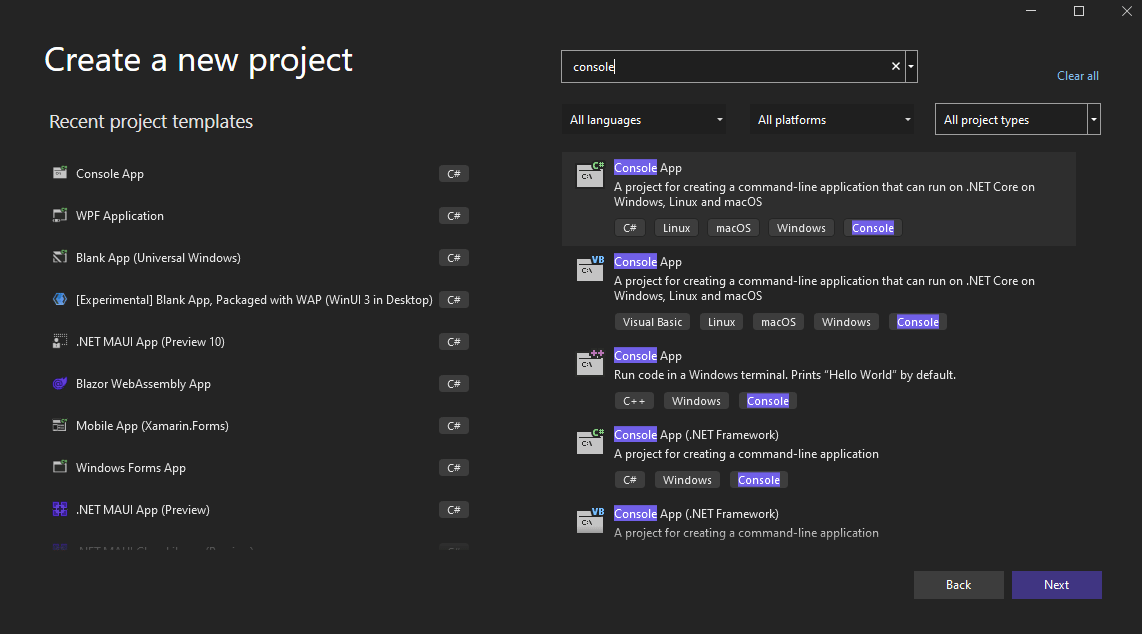
The next code block build a CartesianChart, a PieChart and a GeoMap chart as images, to reproduce this sample
create a new ConsoleApplication in VisualStudio 2022, select .Net 6.0 as the framework.
The Net 6.0 template is much cleaner than previous console app templates, notice also that LiveCharts is available in .NET 5.0, .NET core 3.1 or .NET framework (classic) 4.6.2 or greater.
Finally build the images in the Program.cs file.
~/../samples/ConsoleSample/ConsoleSample/Program.cs```

:::tip
Notice that the previous code also works in an `ASP.net` project, as far as you are using .NET core 3.1 or greater
:::