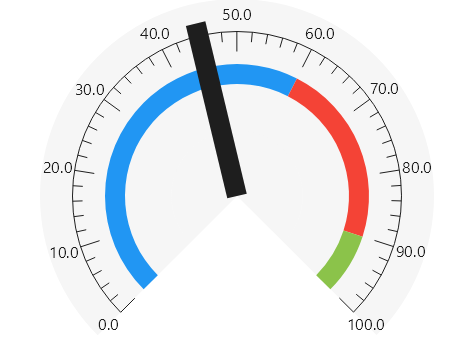
Angular Gauge
This sample uses C# 13 preview features such as partial properties, it also uses features from the CommunityToolkit.Mvvm package, you can learn more about it here.
View model
using CommunityToolkit.Mvvm.Input;
using System;
using CommunityToolkit.Mvvm.ComponentModel;

namespace ViewModelsSamples.Pies.AngularGauge;

public partial class ViewModel : ObservableObject
{
    private readonly Random _random = new();

    [ObservableProperty]
    public partial double Value { get; set; } = 45;

    public Func<double, string> Labeler { get; set; } =
        value => value.ToString("N1");

    [RelayCommand]
    public void DoRandomChange() =>
        Value = _random.Next(0, 100);
}
XAML
<UserControl
    x:Class="WPFSample.Pies.AngularGauge.View"
    xmlns="http://schemas.microsoft.com/winfx/2006/xaml/presentation"
    xmlns:x="http://schemas.microsoft.com/winfx/2006/xaml"
    xmlns:lvc="clr-namespace:LiveChartsCore.SkiaSharpView.WPF;assembly=LiveChartsCore.SkiaSharpView.WPF"
    xmlns:vms="clr-namespace:ViewModelsSamples.Pies.AngularGauge;assembly=ViewModelsSamples"
    MaxHeight="400"
    MaxWidth="400">

    <UserControl.DataContext>
        <vms:ViewModel/>
    </UserControl.DataContext>

    <Grid>
        <Grid.RowDefinitions>
            <RowDefinition Height="Auto"/>
            <RowDefinition Height="*"/>
        </Grid.RowDefinitions>

        <Button
            Grid.Row="0"
            Command="{Binding DoRandomChangeCommand}"
            Content="Change value"/>

        <lvc:PieChart
            Grid.Row="1"
            InitialRotation="-225"
            MaxAngle="270"
            MinValue="0"
            MaxValue="100">
            <lvc:PieChart.Series>
                <lvc:SeriesCollection>
                    <lvc:XamlAngularGaugeSeries
                        GaugeValue="60"
                        OuterRadiusOffset="130"
                        MaxRadialColumnWidth="20"
                        CornerRadius="0"/>
                    <lvc:XamlAngularGaugeSeries
                        GaugeValue="30"
                        OuterRadiusOffset="130"
                        MaxRadialColumnWidth="20"
                        CornerRadius="0"/>
                    <lvc:XamlAngularGaugeSeries
                        GaugeValue="10"
                        OuterRadiusOffset="130"
                        MaxRadialColumnWidth="20"
                        CornerRadius="0"/>
                </lvc:SeriesCollection>
            </lvc:PieChart.Series>
            <lvc:PieChart.VisualElements>
                <lvc:VisualsCollection>
                    <lvc:XamlNeedle
                        Width="20"
                        Value="{Binding Value}"/>
                    <lvc:XamlAngularTicks
                        LabelsSize="16"
                        LabelsOuterOffset="15"
                        OuterOffset="65"
                        TicksLength="20" />
                </lvc:VisualsCollection>
            </lvc:PieChart.VisualElements>
        </lvc:PieChart>
    </Grid>

</UserControl>
Custom needle
You can inherit from NeedleGeometry to change the aspect of the needle, for example in the next code snippet,
the SmallNeedle class inherits from NeedleGeometry, then in the constructor it sets the ScaleTransform
property to 0.6 in the X and Y axis, this will make the needle 40% smaller.
using LiveChartsCore.SkiaSharpView.Drawing.Geometries;

namespace ViewModelsSamples.Pies.AngularGauge;

public class SmallNeedle : NeedleGeometry
{
    public SmallNeedle()
    {
        ScaleTransform = new(0.6f, 0.6f);
    }
}
Finally we need to use this new needle in our gauge, in the example above change the type NeedleVisual
to NeedleVisual<SmallNeedle>.
public partial class ViewModel
{
    // ...

    public NeedleVisual<SmallNeedle> Needle { get; set; }

    public ViewModel()
    {
        Needle = new NeedleVisual<SmallNeedle>
        {
            Value = 45
        };

        // ...
    }

    // ...
}
Run the app again, now the needle is 40% smaller.
You can also override the Draw() method and use SkiaSharp to create your own needle, in the next snippet,
we are drawing a rectangle using SkiaSharp to represent the needle:
using LiveChartsCore.SkiaSharpView.Drawing;
using LiveChartsCore.SkiaSharpView.Drawing.Geometries;

namespace ViewModelsSamples.Pies.AngularGauge;

public class CustomNeedle : NeedleGeometry
{
    public override void Draw(SkiaSharpDrawingContext context)
    {
        var paint = context.ActiveSkiaPaint;

        context.Canvas.DrawRect(X - Width * 0.5f, Y, Width, Radius, paint);
    }
}
Finally we need to use this new needle in our gauge:"
public partial class ViewModel
{
    // ...

    public NeedleVisual<CustomNeedle> Needle { get; set; }

    public ViewModel()
    {
        Needle = new NeedleVisual<CustomNeedle>
        {
            Value = 45
        };

        // ...
    }

    // ...
}
Run the app again, now there is a rectangle as our needle:
You can draw anything with SkiaSharp, this article does not explain how to do it. If you need help, you can see the default NeedleGeometry source code, or you can follow any SkiaSharp guide.