Row Series
View model
using SkiaSharp;
using LiveChartsCore;
using LiveChartsCore.Measure;
using LiveChartsCore.SkiaSharpView;
using LiveChartsCore.SkiaSharpView.Painting;
namespace ViewModelsSamples.Bars.RowsWithLabels;
public class ViewModel
{
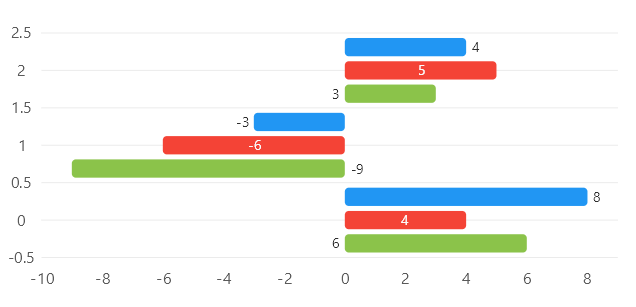
public ISeries[] Series { get; set; } = [
new RowSeries<int>
{
Values = [8, -3, 4],
Stroke = null,
DataLabelsPaint = new SolidColorPaint(new SKColor(45, 45, 45)),
DataLabelsSize = 14,
DataLabelsPosition = DataLabelsPosition.End
},
new RowSeries<int>
{
Values = [4, -6, 5],
Stroke = null,
DataLabelsPaint = new SolidColorPaint(new SKColor(250, 250, 250)),
DataLabelsSize = 14,
DataLabelsPosition = DataLabelsPosition.Middle
},
new RowSeries<int>
{
Values = [6, -9, 3],
Stroke = null,
DataLabelsPaint = new SolidColorPaint(new SKColor(45, 45, 45)),
DataLabelsSize = 14,
DataLabelsPosition = DataLabelsPosition.Start
}
];
}
using Eto.Forms;
using LiveChartsCore.SkiaSharpView.Eto;
using ViewModelsSamples.Bars.RowsWithLabels;

namespace EtoFormsSample.Bars.RowsWithLabels;

public class View : Panel
{
    private readonly CartesianChart cartesianChart;

    public View()
    {
        var viewModel = new ViewModel();

        cartesianChart = new CartesianChart
        {
            Series = viewModel.Series,
        };

        Content = cartesianChart;
    }
}
Articles you might also find useful: