Row Series
This web site builds the control from code behind but you could also grab it from the toolbox, this sample also uses a ViewModel to populate the properties of the control(s) in this sample.
View model
using SkiaSharp;
using LiveChartsCore;
using LiveChartsCore.Measure;
using LiveChartsCore.SkiaSharpView;
using LiveChartsCore.SkiaSharpView.Painting;
namespace ViewModelsSamples.Bars.RowsWithLabels;
public class ViewModel
{
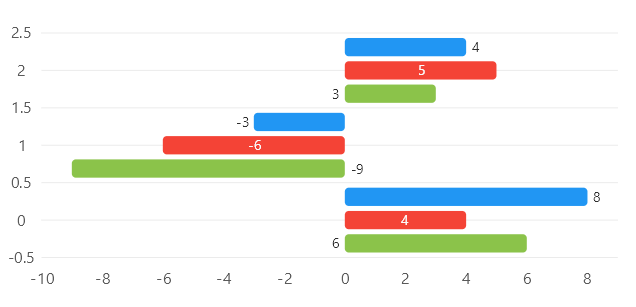
public ISeries[] Series { get; set; } = [
new RowSeries<int>
{
Values = [8, -3, 4],
Stroke = null,
DataLabelsPaint = new SolidColorPaint(new SKColor(45, 45, 45)),
DataLabelsSize = 14,
DataLabelsPosition = DataLabelsPosition.End
},
new RowSeries<int>
{
Values = [4, -6, 5],
Stroke = null,
DataLabelsPaint = new SolidColorPaint(new SKColor(250, 250, 250)),
DataLabelsSize = 14,
DataLabelsPosition = DataLabelsPosition.Middle
},
new RowSeries<int>
{
Values = [6, -9, 3],
Stroke = null,
DataLabelsPaint = new SolidColorPaint(new SKColor(45, 45, 45)),
DataLabelsSize = 14,
DataLabelsPosition = DataLabelsPosition.Start
}
];
}
Form code behind
using System.Windows.Forms;
using LiveChartsCore.SkiaSharpView.WinForms;
using ViewModelsSamples.Bars.RowsWithLabels;

namespace WinFormsSample.Bars.RowsWithLabels;

public partial class View : UserControl
{
    private readonly CartesianChart cartesianChart;

    public View()
    {
        InitializeComponent();
        Size = new System.Drawing.Size(50, 50);

        var viewModel = new ViewModel();

        cartesianChart = new CartesianChart
        {
            Series = viewModel.Series,

            // out of livecharts properties...
            Location = new System.Drawing.Point(0, 0),
            Size = new System.Drawing.Size(50, 50),
            Anchor = AnchorStyles.Left | AnchorStyles.Right | AnchorStyles.Top | AnchorStyles.Bottom
        };

        Controls.Add(cartesianChart);
    }
}